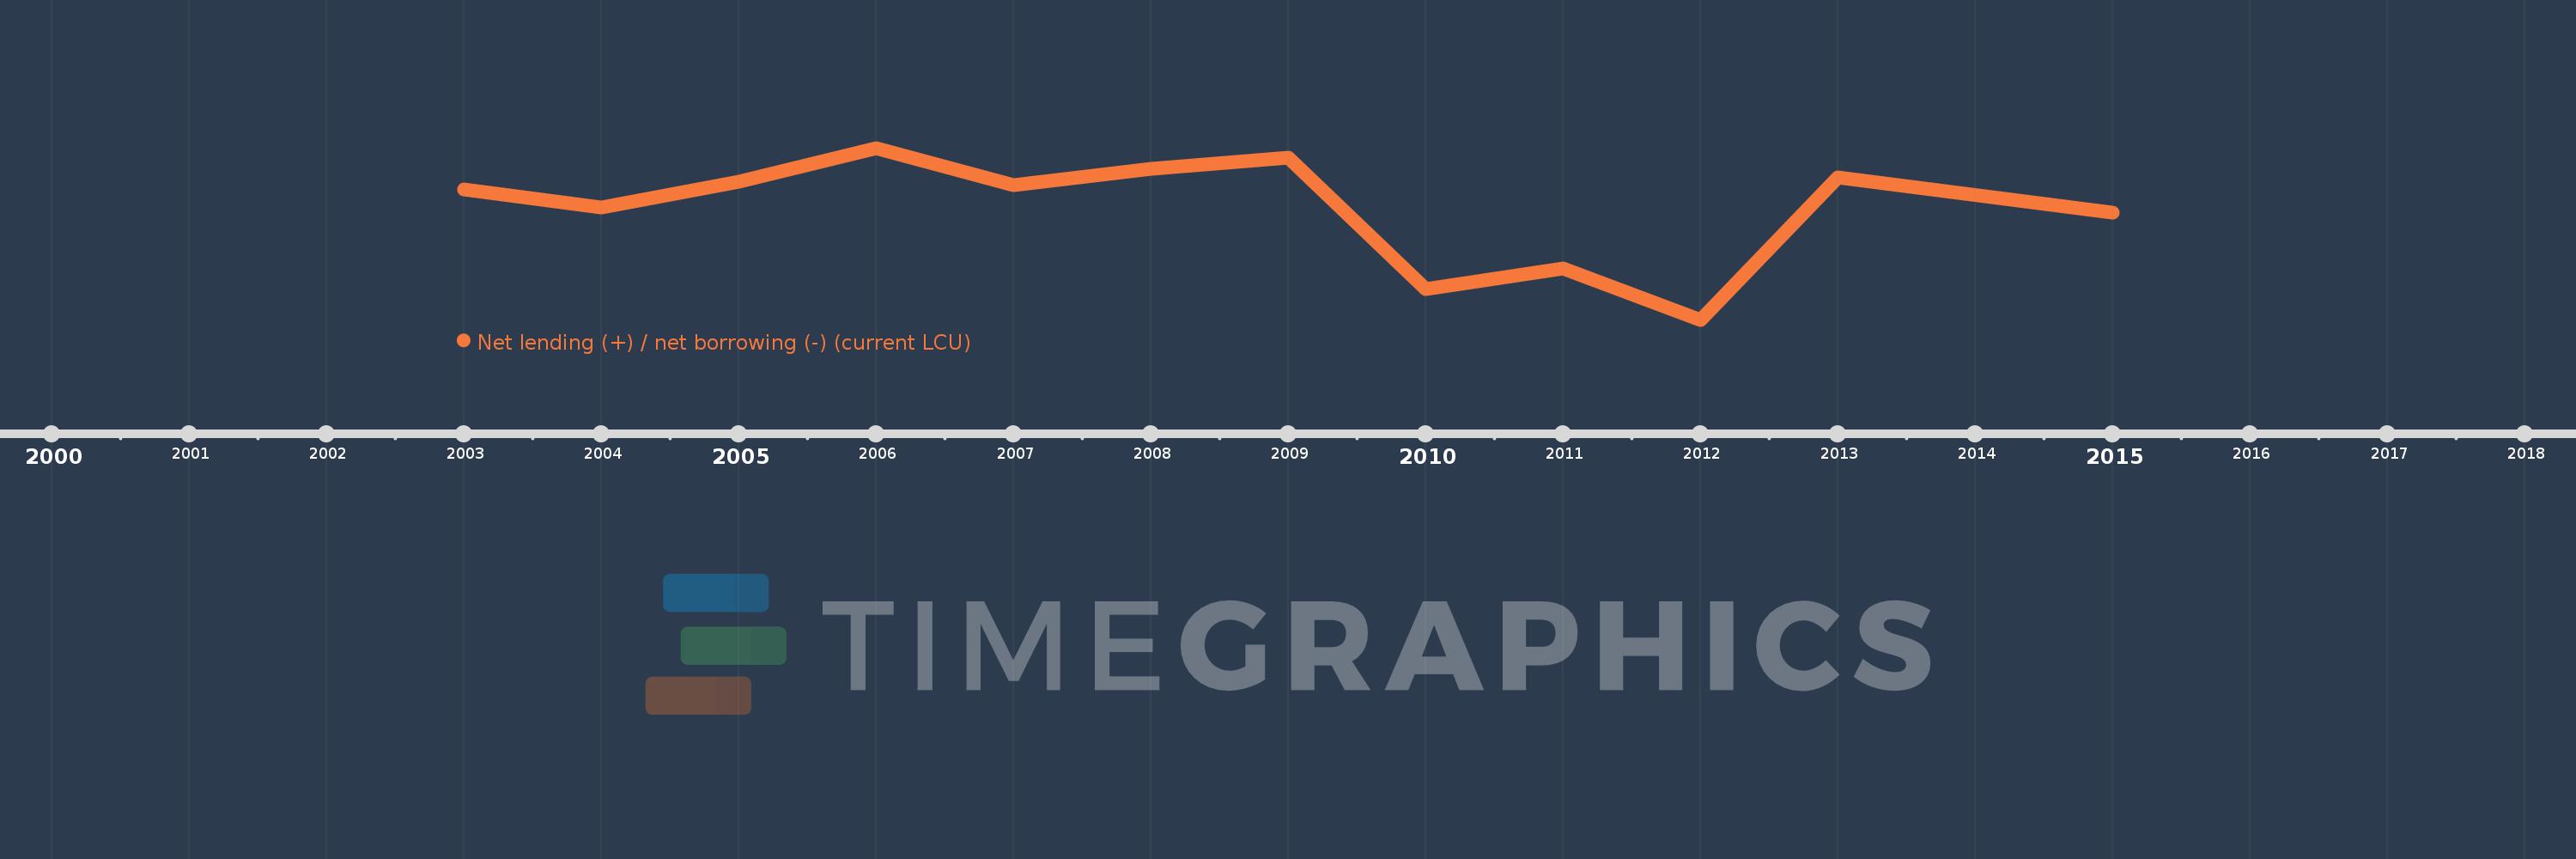
Questa scala temporale mostra un grafico dal 2003 anno al 2015 anno. Cambodia. I dati fino ad 2002 anno non disponibili. Il numero di osservazioni attuali secondo i date: 12.
La fonte (nome):
Indicatori dello sviluppo mondiale
La fonte (organizzazione):
International Monetary Fund, Government Finance Statistics Yearbook and data files.
Categorie:
Public Sector
sono stati aggiornati
23 apr 2017 anni
Indicatori delle variazioni dei valori per anni
In media:
-837.454 Mlrd
Minima:
-2.376 Trln
1 gen 2012 anni
Massimo:
10.393 Mlrd
1 gen 2006 anni
Alla data di osservazione
Valore
Variazione assoluta
La variazione rispetto al valore precedente
1 gen 2003 anni
-568.002 Mlrd
-568.002 Mlrd
0.0%
1 gen 2004 anni
-819.18 Mlrd
-251.177 Mlrd
44.22%
1 gen 2005 anni
-462.509 Mlrd
+356.671 Mlrd
-43.54%
1 gen 2006 anni
10.393 Mlrd
+472.902 Mlrd
-102.25%
1 gen 2007 anni
-511.413 Mlrd
-521.806 Mlrd
-5.02 Mille.%
1 gen 2008 anni
-281.921 Mlrd
+229.492 Mlrd
-44.87%
1 gen 2009 anni
-129.285 Mlrd
+152.636 Mlrd
-54.14%
1 gen 2010 anni
-1.954 Trln
-1.824 Trln
1.41 Mille.%
1 gen 2011 anni
-1.66 Trln
+294.25 Mlrd
-15.06%
1 gen 2012 anni
-2.376 Trln
-716.888 Mlrd
43.2%
1 gen 2013 anni
-404.157 Mlrd
+1.972 Trln
-82.99%
1 gen 2015 anni
-893.645 Mlrd
-489.488 Mlrd
121.11%
Classificazione dei paesi secondo i statistiche attuali per anni