Download Queste statistiche in altri paesi:
AfghanistanAlbaniaAlgeriaAngolaAntigua and BarbudaArmeniaAustraliaAustriaAzerbaijanBahamas, TheBahrainBangladeshBarbadosBelarusBelgiumBelizeBhutanBoliviaBosnia and HerzegovinaBrazilBurundiCabo VerdeCambodiaCanadaCentral African RepublicChileCongo, Dem. Rep.Congo, Rep.Costa RicaCote d'IvoireCroatiaCyprusCzech RepublicDenmarkDominicaDominican RepublicEgypt, Arab Rep.El SalvadorEquatorial GuineaEstoniaEthiopiaFijiFinlandFranceGambia, TheGeorgiaGermanyGreeceGuatemalaHondurasHungaryIcelandIndiaIndonesiaIran, Islamic Rep.IraqIrelandIsraelItalyJamaicaKazakhstanKiribatiKorea, Rep.Kyrgyz RepublicLao PDRLatviaLebanonLithuaniaLuxembourgMacao SAR, ChinaMacedonia, FYRMadagascarMalawiMaldivesMaliMaltaMauritiusMexicoMicronesia, Fed. Sts.MoldovaMongoliaMoroccoMozambiqueNamibiaNepalNetherlandsNew ZealandNicaraguaNigeriaNorwayOmanPakistanParaguayPeruPhilippinesPolandPortugalQatarRomaniaRussian FederationRwandaSamoaSan MarinoSao Tome and PrincipeSenegalSerbiaSierra LeoneSingaporeSlovak RepublicSolomon IslandsSouth AfricaSpainSri LankaSurinameSwazilandSwedenSwitzerlandSyrian Arab RepublicThailandTimor-LesteTrinidad and TobagoTurkeyUgandaUkraineUnited Arab EmiratesUnited KingdomUnited StatesUruguayVanuatuVietnamWest Bank and GazaYemen, Rep.Zimbabwe Linea del tempo:
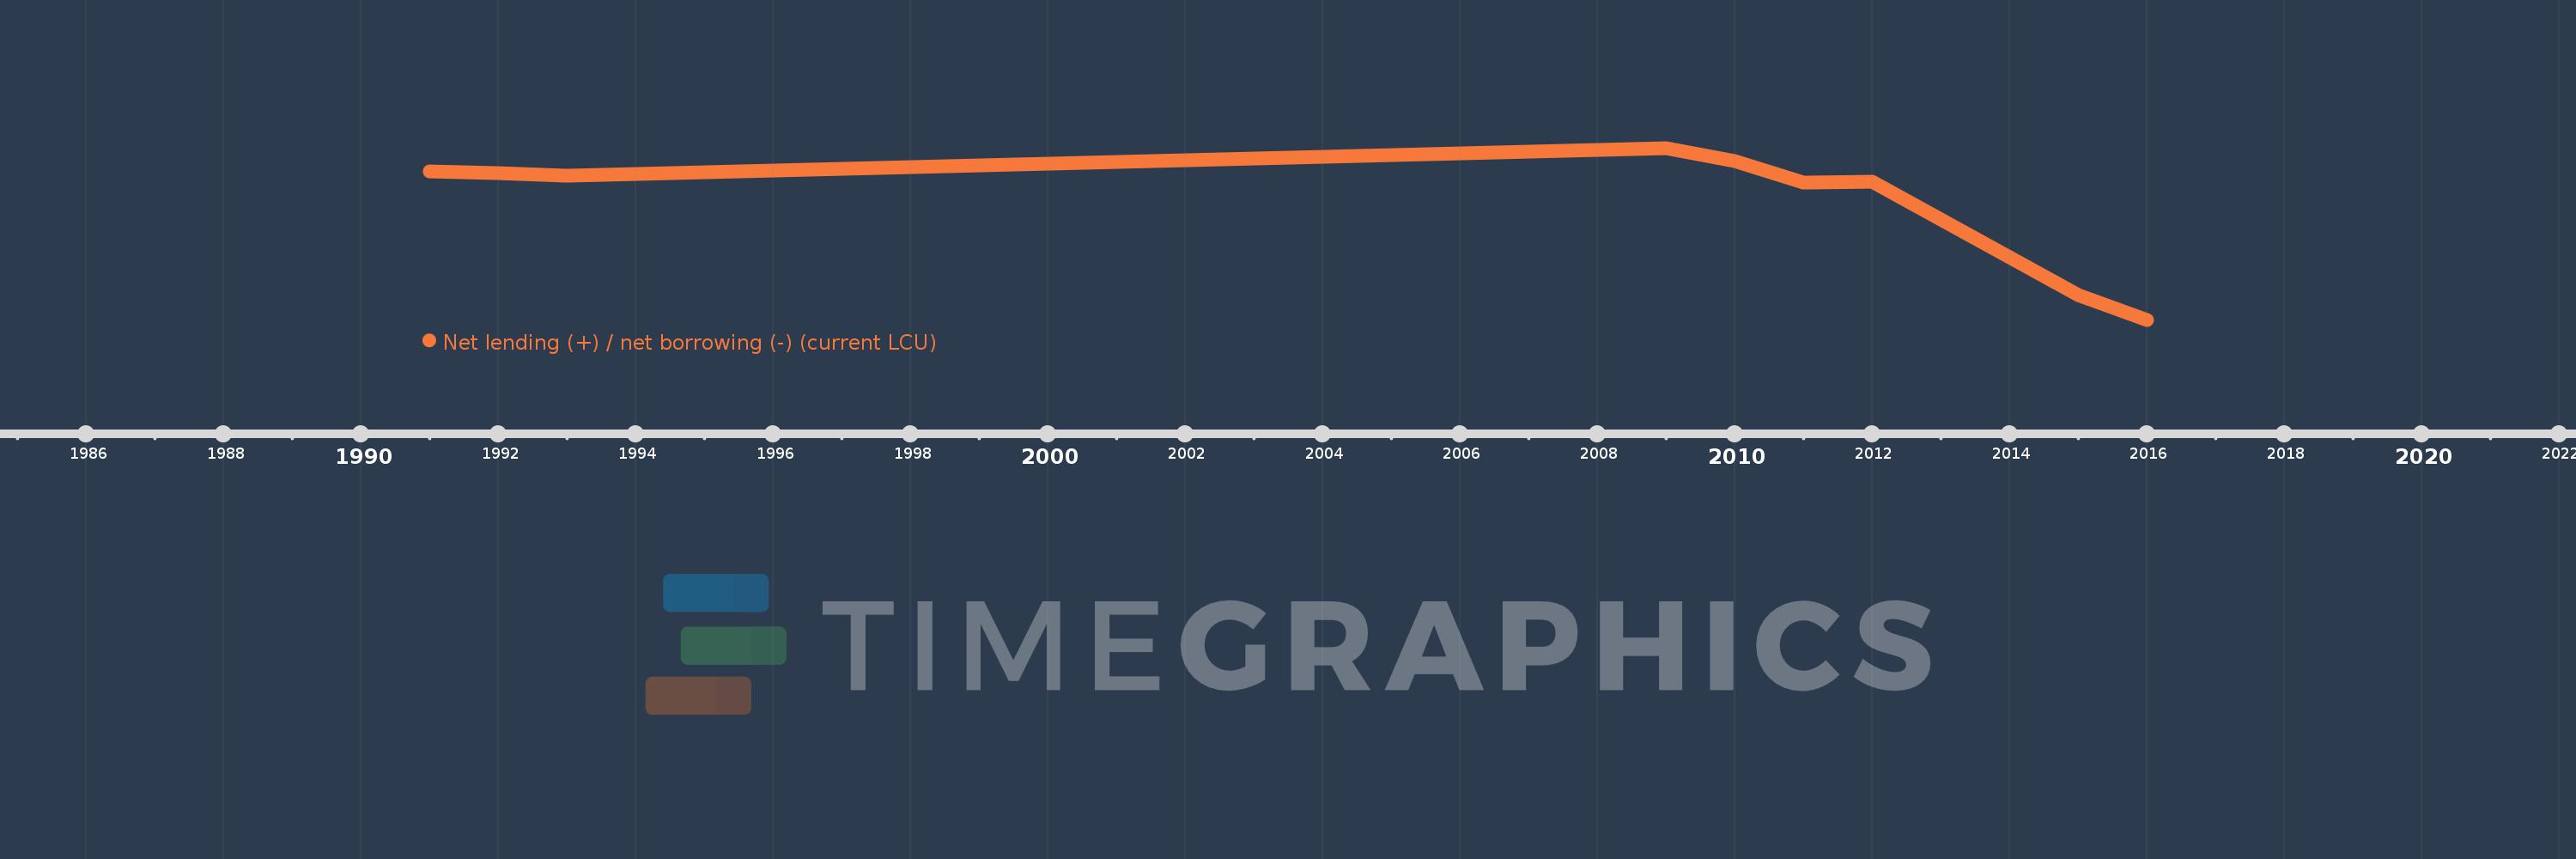
Questa scala temporale mostra un grafico dal 1991 anno al 2016 anno. Rwanda. I dati fino ad 1990 anno non disponibili. Il numero di osservazioni attuali secondo i date: 9.
La fonte (nome):
Indicatori dello sviluppo mondiale
La fonte (organizzazione):
International Monetary Fund, Government Finance Statistics Yearbook and data files.
Categorie:
Public Sector
sono stati aggiornati
23 apr 2017 anni
Indicatori delle variazioni dei valori per anni
Minima:
-245.627 Mlrd
1 gen 2016 anni
Massimo:
16.476 Mlrd
1 gen 2009 anni
Alla data di osservazione
Valore
Variazione assoluta
La variazione rispetto al valore precedente
1 gen 1991 anni
-18.719 Mlrd
-18.719 Mlrd
0.0%
1 gen 1992 anni
-22.497 Mlrd
-3.778 Mlrd
20.18%
1 gen 1993 anni
-25.326 Mlrd
-2.829 Mlrd
12.58%
1 gen 2009 anni
16.476 Mlrd
+41.802 Mlrd
-165.06%
1 gen 2010 anni
-3.897 Mlrd
-20.374 Mlrd
-123.65%
1 gen 2011 anni
-35.835 Mlrd
-31.937 Mlrd
819.5%
1 gen 2012 anni
-35.484 Mlrd
+350.584 Mln
-0.98%
1 gen 2015 anni
-207.729 Mlrd
-172.245 Mlrd
485.42%
1 gen 2016 anni
-245.627 Mlrd
-37.897 Mlrd
18.24%
Classificazione dei paesi secondo i statistiche attuali per anni