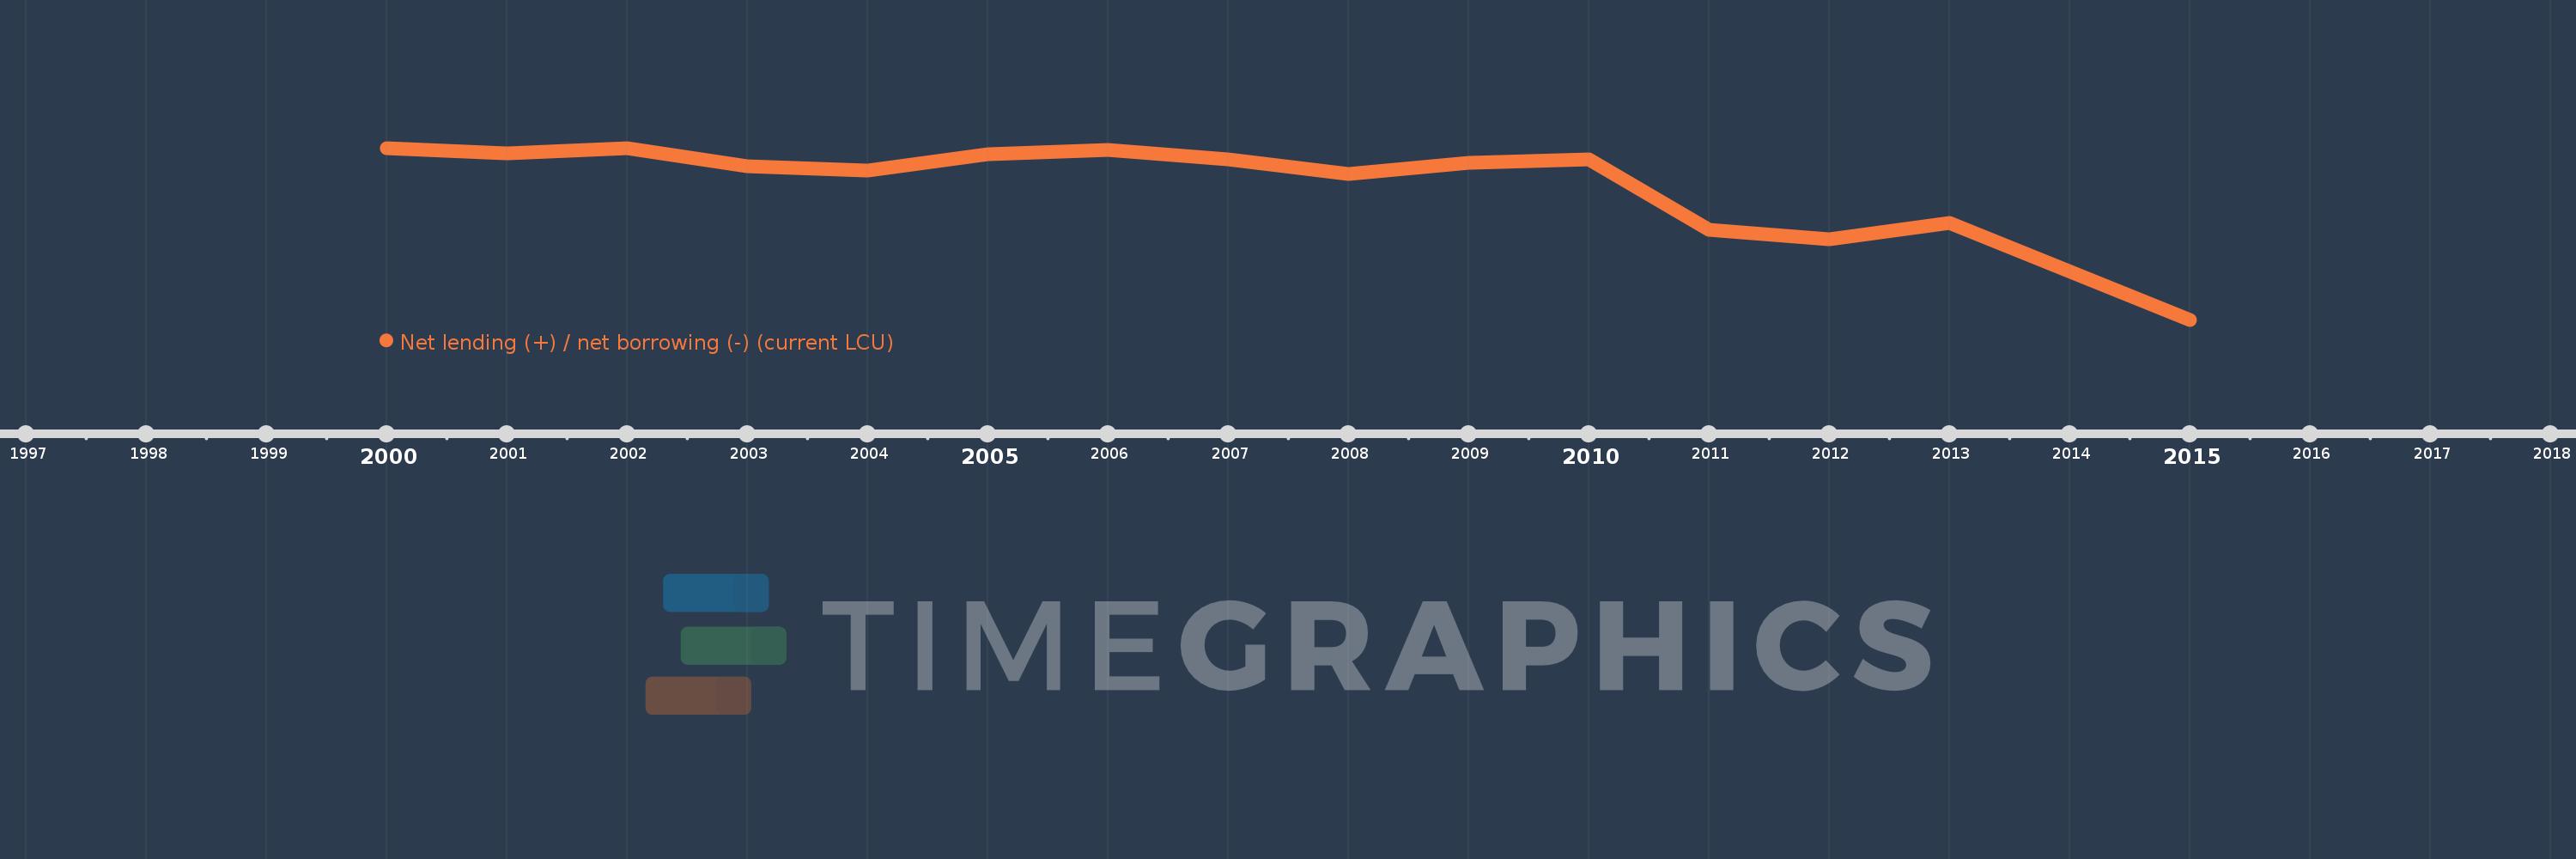
Questa scala temporale mostra un grafico dal 2000 anno al 2015 anno. Uganda. I dati fino ad 1999 anno non disponibili. Il numero di osservazioni attuali secondo i date: 15.
La fonte (nome):
Indicatori dello sviluppo mondiale
La fonte (organizzazione):
International Monetary Fund, Government Finance Statistics Yearbook and data files.
Categorie:
Public Sector
sono stati aggiornati
23 apr 2017 anni
Indicatori delle variazioni dei valori per anni
In media:
-655.234 Mlrd
Minima:
-2.772 Trln
1 gen 2015 anni
Massimo:
-96.759 Mlrd
1 gen 2000 anni
Alla data di osservazione
Valore
Variazione assoluta
La variazione rispetto al valore precedente
1 gen 2000 anni
-96.759 Mlrd
-96.759 Mlrd
0.0%
1 gen 2001 anni
-175.372 Mlrd
-78.613 Mlrd
81.25%
1 gen 2002 anni
-97.666 Mlrd
+77.706 Mlrd
-44.31%
1 gen 2003 anni
-380.84 Mlrd
-283.174 Mlrd
289.94%
1 gen 2004 anni
-443.897 Mlrd
-63.058 Mlrd
16.56%
1 gen 2005 anni
-197.805 Mlrd
+246.092 Mlrd
-55.44%
1 gen 2006 anni
-123.674 Mlrd
+74.131 Mlrd
-37.48%
1 gen 2007 anni
-279.073 Mlrd
-155.4 Mlrd
125.65%
1 gen 2008 anni
-500.985 Mlrd
-221.911 Mlrd
79.52%
1 gen 2009 anni
-332.651 Mlrd
+168.333 Mlrd
-33.6%
1 gen 2010 anni
-277.55 Mlrd
+55.102 Mlrd
-16.56%
1 gen 2011 anni
-1.373 Trln
-1.095 Trln
394.56%
1 gen 2012 anni
-1.517 Trln
-144.129 Mlrd
10.5%
1 gen 2013 anni
-1.26 Trln
+256.398 Mlrd
-16.9%
1 gen 2015 anni
-2.772 Trln
-1.512 Trln
119.97%
Classificazione dei paesi secondo i statistiche attuali per anni