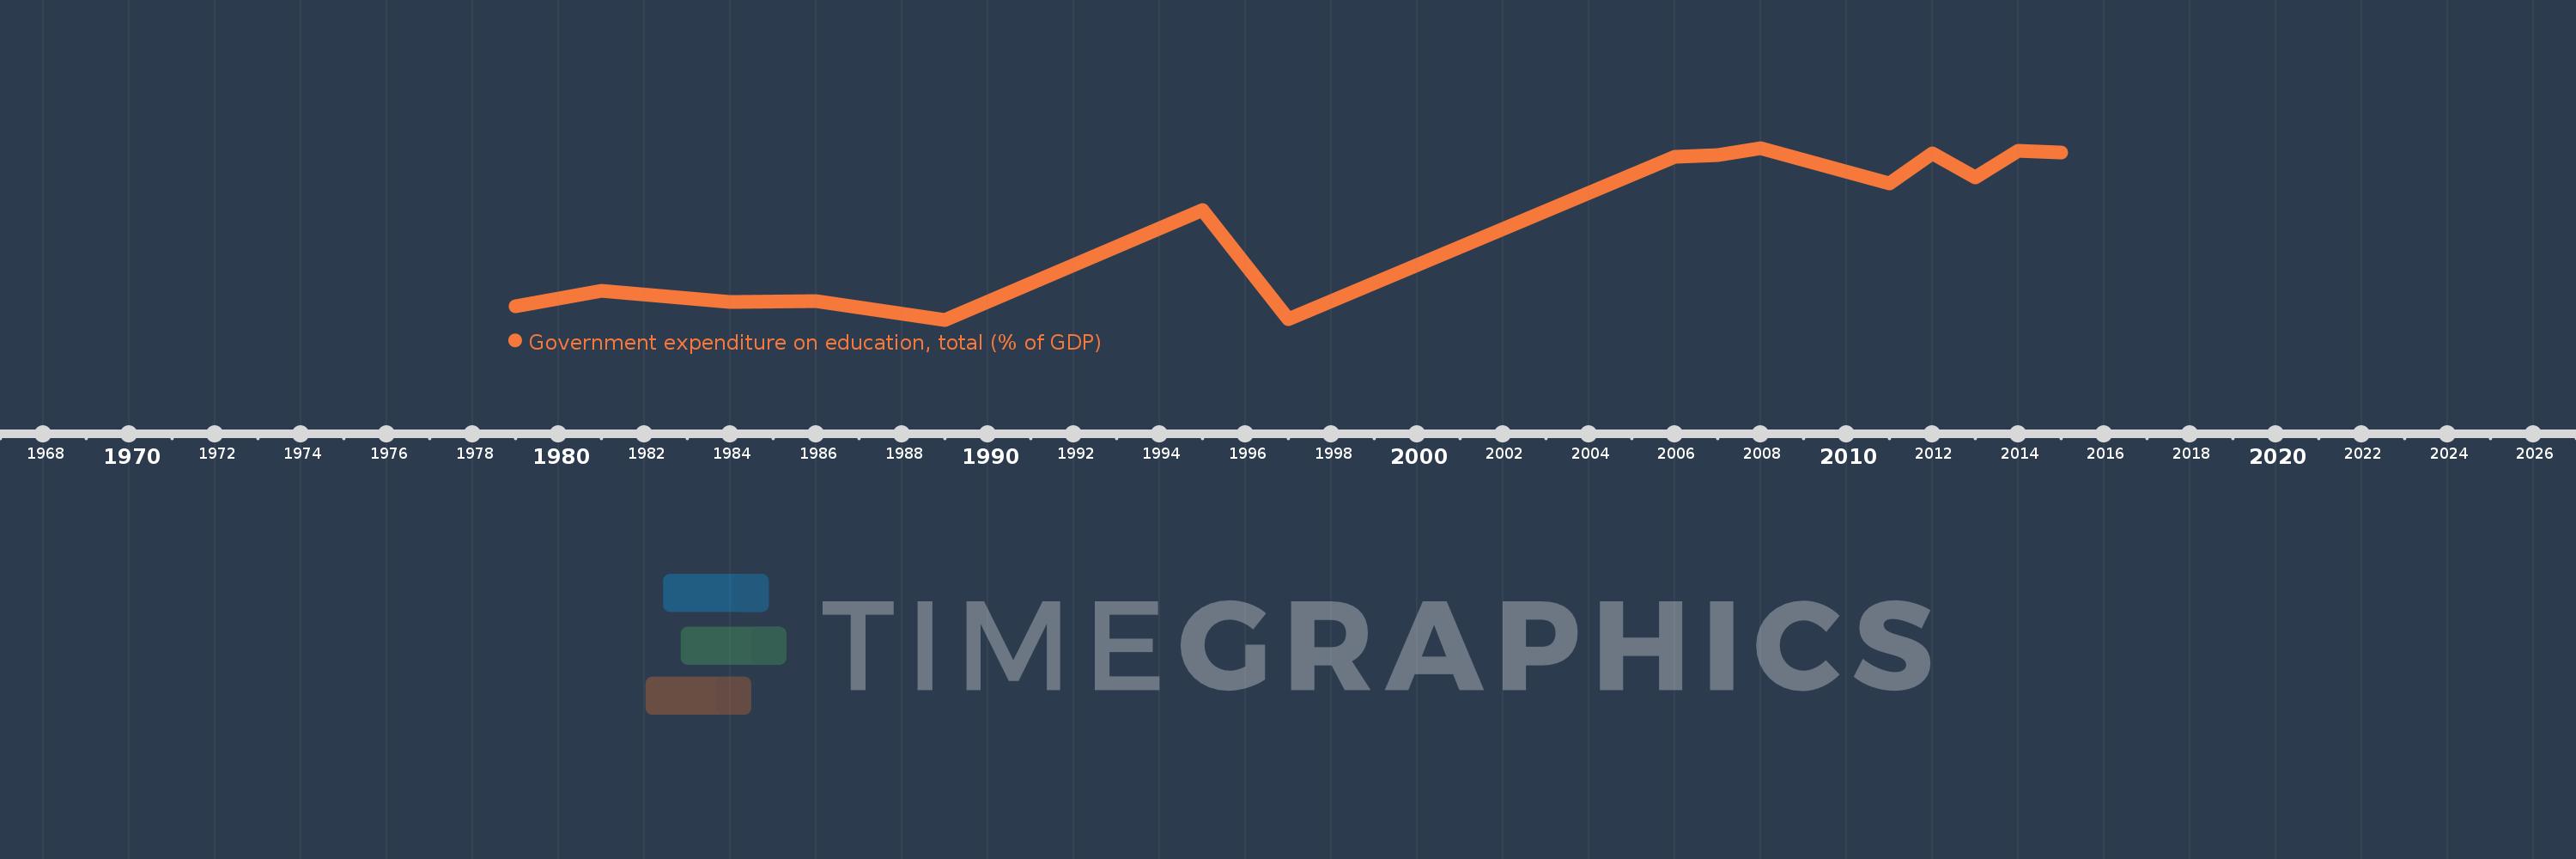
Questa scala temporale mostra un grafico dal 1979 anno al 2015 anno. Burkina Faso. I dati fino ad 1978 anno non disponibili. Il numero di osservazioni attuali secondo i date: 15.
La fonte (nome):
Indicatori dello sviluppo mondiale
La fonte (organizzazione):
United Nations Educational, Scientific, and Cultural Organization (UNESCO) Institute for Statistics.
Categorie:
Education
sono stati aggiornati
23 apr 2017 anni
Indicatori delle variazioni dei valori per anni
In media:
3.231
Minima:
1.426
1 gen 1989 anni
Massimo:
4.589
1 gen 2008 anni
Alla data di osservazione
Valore
Variazione assoluta
La variazione rispetto al valore precedente
1 gen 1979 anni
1.68
+1.68
0.0%
1 gen 1981 anni
1.962
+0.282
16.79%
1 gen 1984 anni
1.754
-0.207
-10.57%
1 gen 1986 anni
1.764
+0.009
0.54%
1 gen 1989 anni
1.426
-0.338
-19.15%
1 gen 1995 anni
3.451
+2.025
142.0%
1 gen 1997 anni
1.44
-2.011
-58.27%
1 gen 2006 anni
4.433
+2.992
207.76%
1 gen 2007 anni
4.457
+0.024
0.55%
1 gen 2008 anni
4.589
+0.132
2.95%
1 gen 2011 anni
3.939
-0.65
-14.16%
1 gen 2012 anni
4.483
+0.544
13.82%
1 gen 2013 anni
4.054
-0.43
-9.59%
1 gen 2014 anni
4.531
+0.477
11.77%
1 gen 2015 anni
4.5
-0.03
-0.67%
Classificazione dei paesi secondo i statistiche attuali per anni