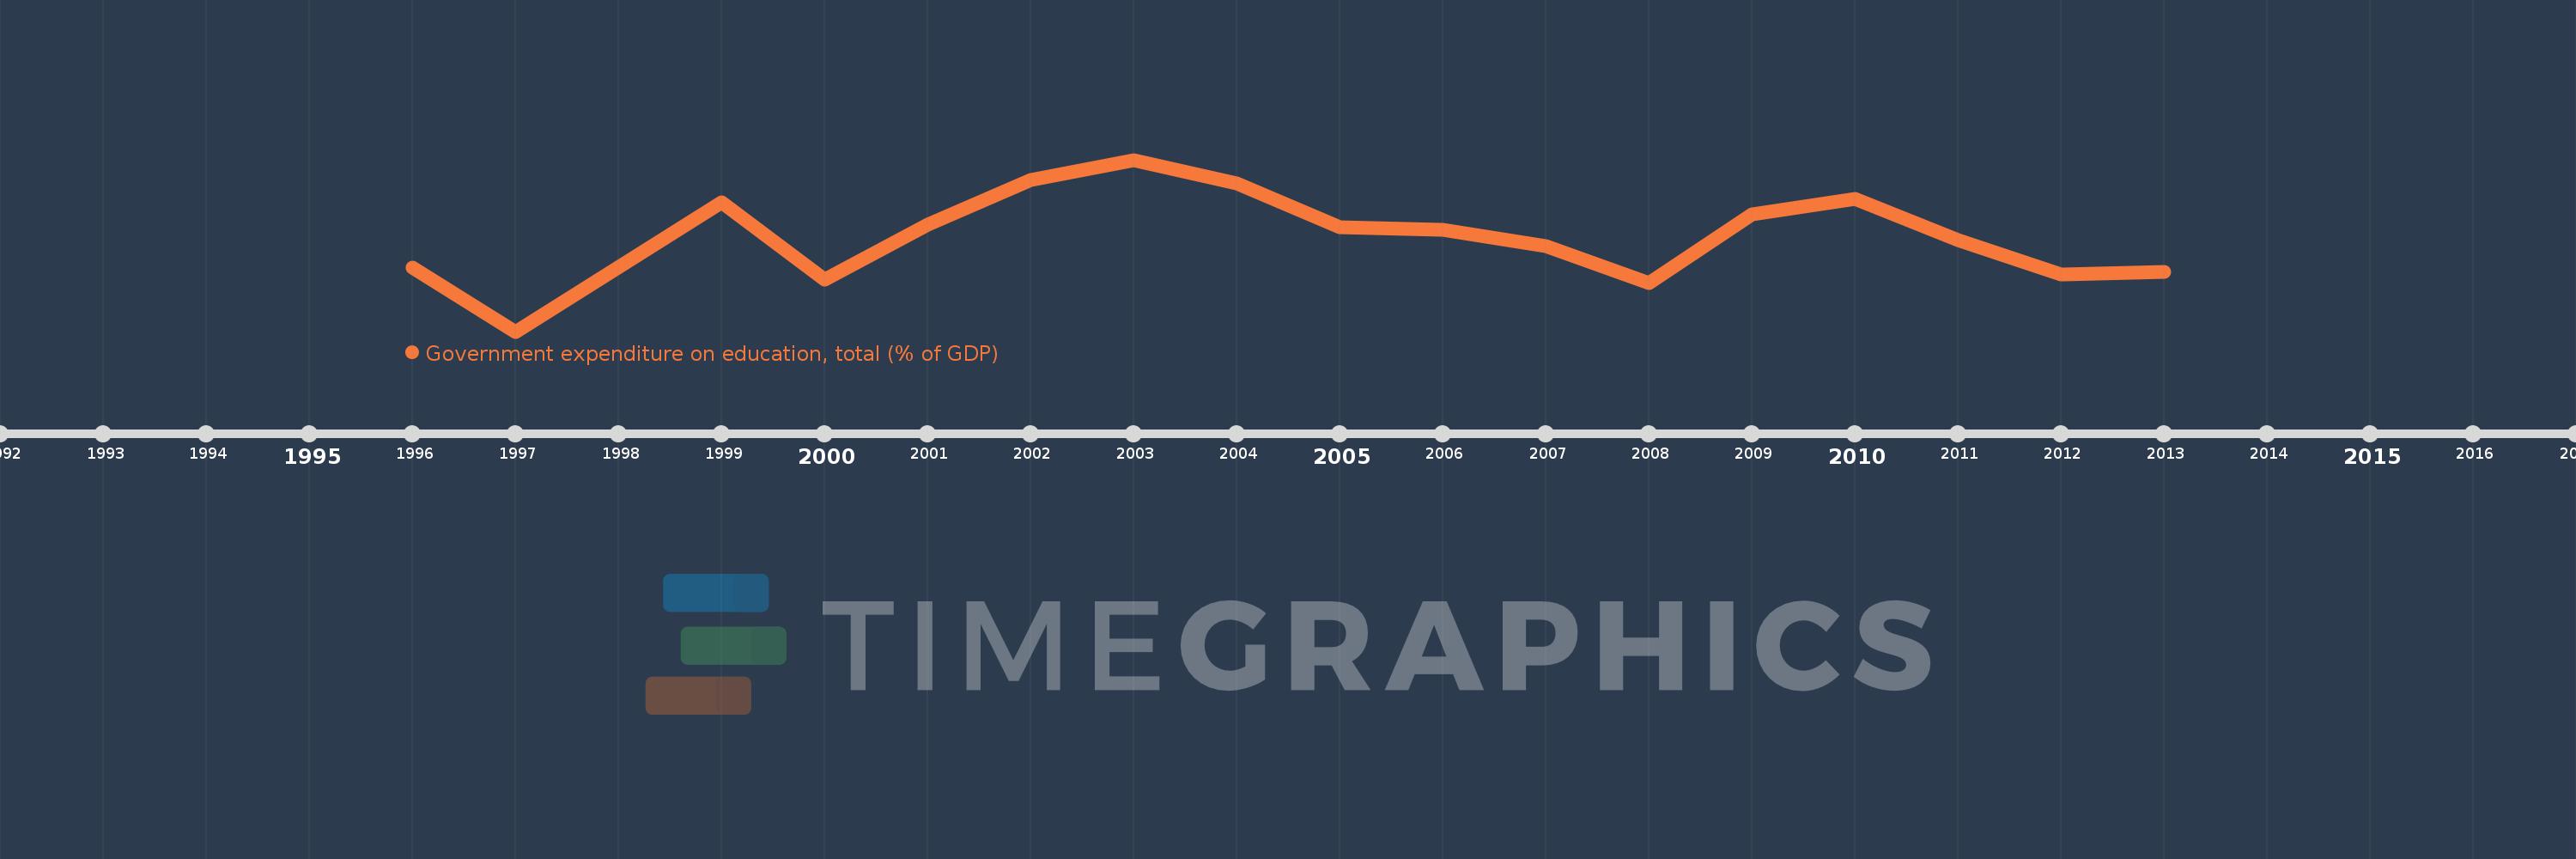
Questa scala temporale mostra un grafico dal 1996 anno al 2013 anno. Central Europe and the Baltics. I dati fino ad 1995 anno non disponibili. Il numero di osservazioni attuali secondo i date: 17.
La fonte (nome):
Indicatori dello sviluppo mondiale
La fonte (organizzazione):
United Nations Educational, Scientific, and Cultural Organization (UNESCO) Institute for Statistics.
Categorie:
Education
sono stati aggiornati
23 apr 2017 anni
Indicatori delle variazioni dei valori per anni
In media:
4.816
Minima:
4.354
1 gen 1997 anni
Massimo:
5.186
1 gen 2003 anni
Alla data di osservazione
Valore
Variazione assoluta
La variazione rispetto al valore precedente
1 gen 1996 anni
4.664
+4.664
0.0%
1 gen 1997 anni
4.354
-0.31
-6.65%
1 gen 1999 anni
4.98
+0.626
14.38%
1 gen 2000 anni
4.606
-0.375
-7.52%
1 gen 2001 anni
4.873
+0.267
5.81%
1 gen 2002 anni
5.088
+0.215
4.4%
1 gen 2003 anni
5.186
+0.098
1.93%
1 gen 2004 anni
5.073
-0.113
-2.18%
1 gen 2005 anni
4.86
-0.213
-4.21%
1 gen 2006 anni
4.845
-0.015
-0.31%
1 gen 2007 anni
4.77
-0.075
-1.54%
1 gen 2008 anni
4.591
-0.179
-3.76%
1 gen 2009 anni
4.921
+0.33
7.19%
1 gen 2010 anni
4.996
+0.075
1.53%
1 gen 2011 anni
4.799
-0.196
-3.93%
1 gen 2012 anni
4.629
-0.171
-3.56%
1 gen 2013 anni
4.644
+0.015
0.32%
Classificazione dei paesi secondo i statistiche attuali per anni