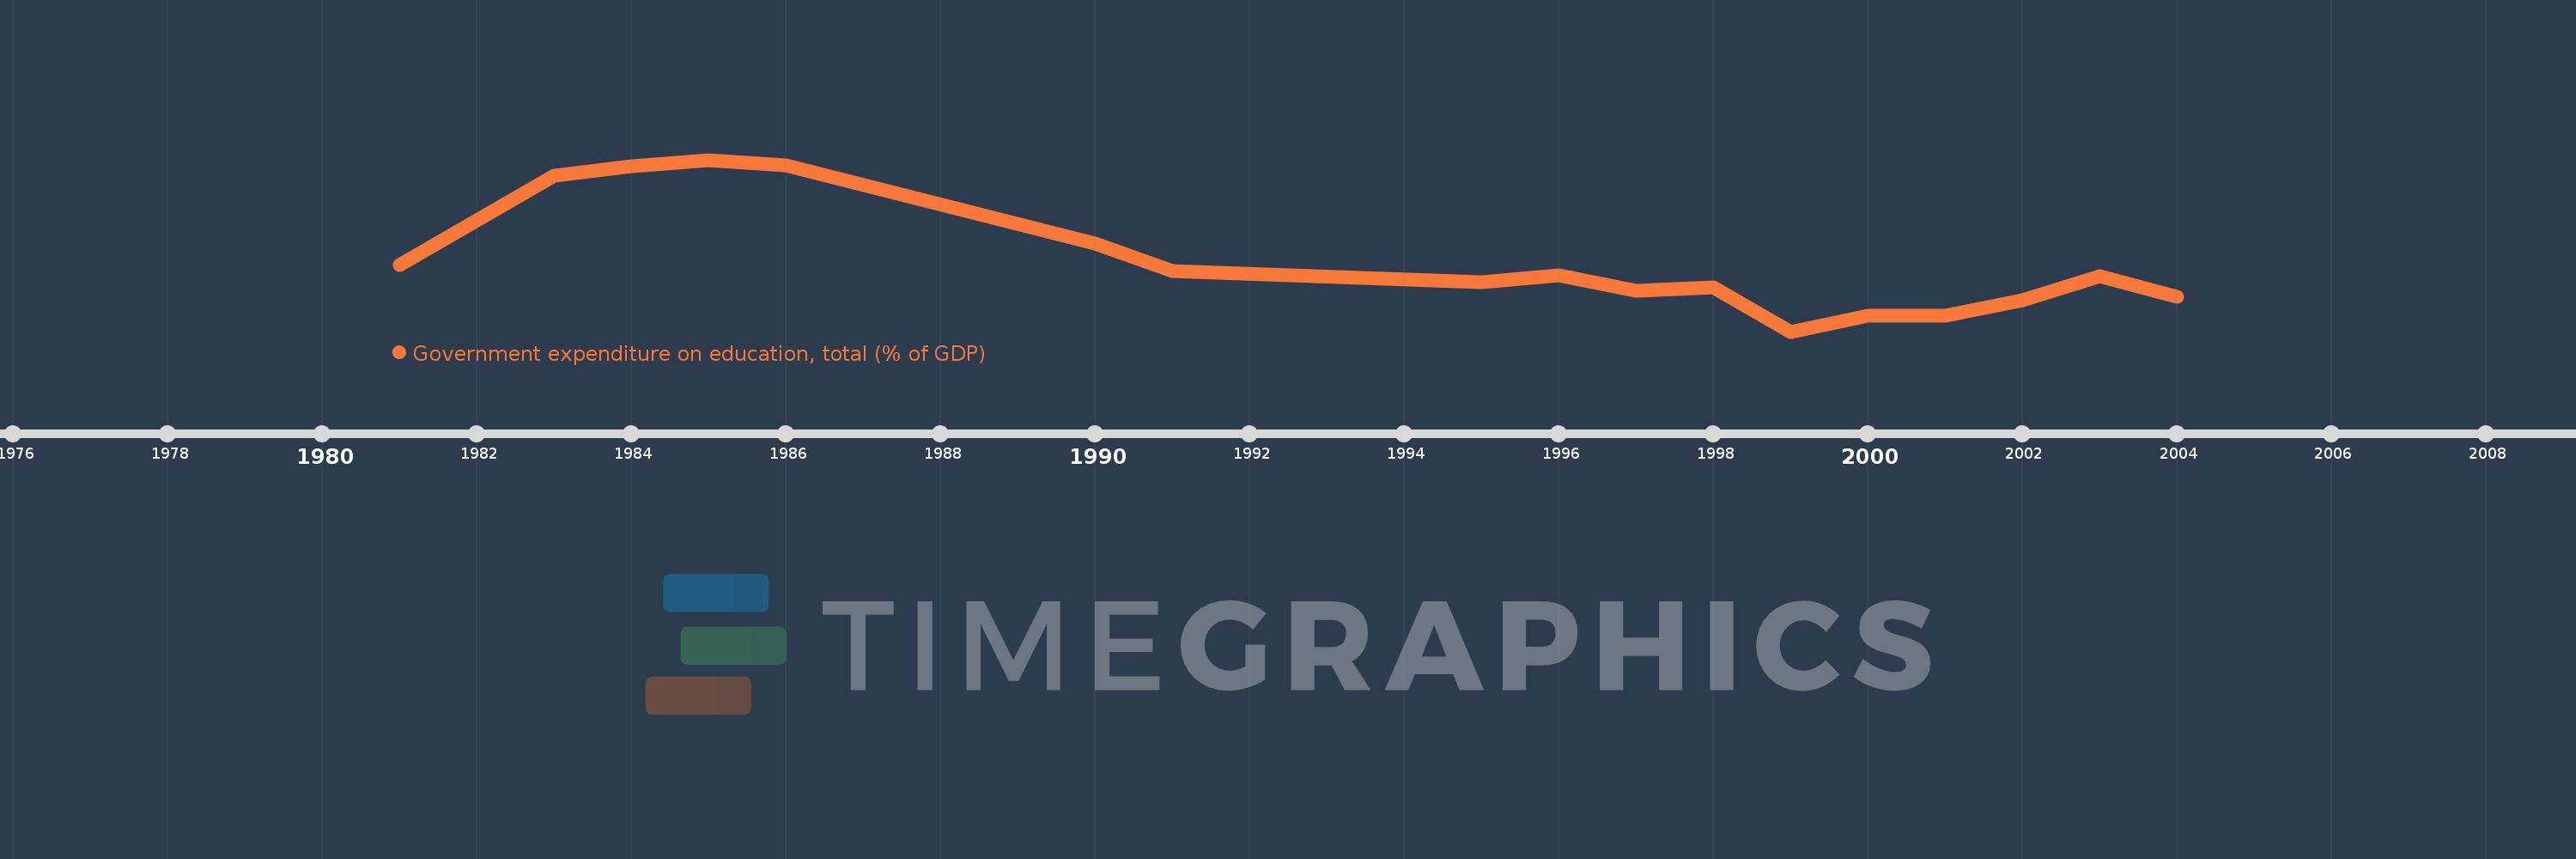
Questa scala temporale mostra un grafico dal 1981 anno al 2004 anno. Trinidad and Tobago. I dati fino ad 1980 anno non disponibili. Il numero di osservazioni attuali secondo i date: 17.
La fonte (nome):
Indicatori dello sviluppo mondiale
La fonte (organizzazione):
United Nations Educational, Scientific, and Cultural Organization (UNESCO) Institute for Statistics.
Categorie:
Education
sono stati aggiornati
23 apr 2017 anni
Indicatori delle variazioni dei valori per anni
In media:
3.872
Minima:
2.439
1 gen 1999 anni
Massimo:
5.875
1 gen 1985 anni
Alla data di osservazione
Valore
Variazione assoluta
La variazione rispetto al valore precedente
1 gen 1981 anni
3.768
+3.768
0.0%
1 gen 1983 anni
5.56
+1.792
47.56%
1 gen 1984 anni
5.74
+0.18
3.23%
1 gen 1985 anni
5.875
+0.135
2.35%
1 gen 1986 anni
5.768
-0.107
-1.82%
1 gen 1990 anni
4.2
-1.568
-27.18%
1 gen 1991 anni
3.654
-0.546
-13.0%
1 gen 1995 anni
3.432
-0.222
-6.08%
1 gen 1996 anni
3.559
+0.127
3.69%
1 gen 1997 anni
3.249
-0.31
-8.71%
1 gen 1998 anni
3.325
+0.076
2.35%
1 gen 1999 anni
2.439
-0.886
-26.65%
1 gen 2000 anni
2.756
+0.317
13.01%
1 gen 2001 anni
2.756
0.0
-0.02%
1 gen 2002 anni
3.065
+0.31
11.24%
1 gen 2003 anni
3.543
+0.478
15.58%
1 gen 2004 anni
3.137
-0.406
-11.47%
Classificazione dei paesi secondo i statistiche attuali per anni