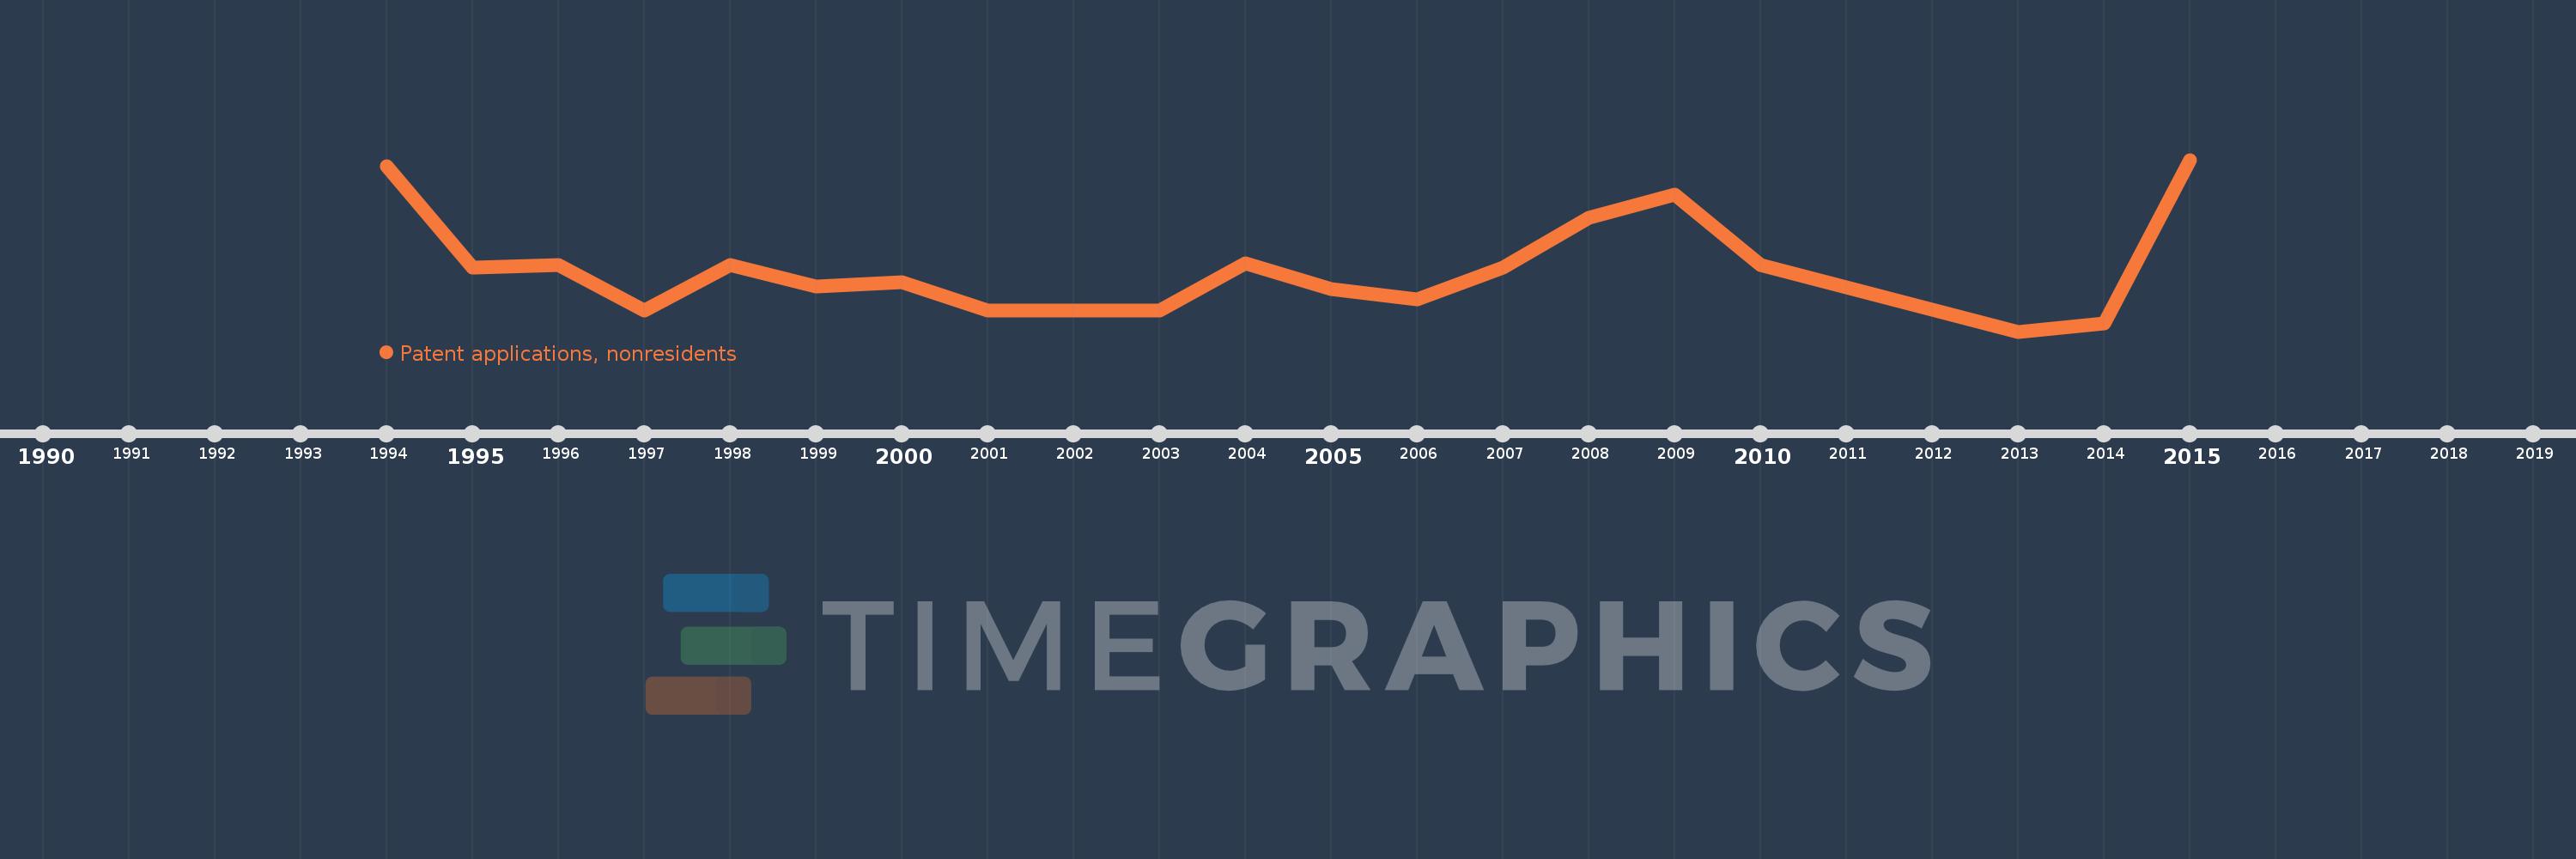
Questa scala temporale mostra un grafico dal 1994 anno al 2015 anno. Brunei Darussalam. I dati fino ad 1993 anno non disponibili. Il numero di osservazioni attuali secondo i date: 20.
La fonte (nome):
Indicatori dello sviluppo mondiale
La fonte (organizzazione):
World Intellectual Property Organization (WIPO), WIPO Patent Report: Statistics on Worldwide Patent Activity. The International Bureau of WIPO assumes no responsibility with respect to the transformation of these data.
Categorie:
Science & Technology
sono stati aggiornati
23 apr 2017 anni
Indicatori delle variazioni dei valori per anni
In media:
40.1
Minima:
11.0
1 gen 2013 anni
Massimo:
91.0
1 gen 2015 anni
Alla data di osservazione
Valore
Variazione assoluta
La variazione rispetto al valore precedente
1 gen 1994 anni
88.0
+88.0
0.0%
1 gen 1995 anni
41.0
-47.0
-53.41%
1 gen 1996 anni
42.0
+1.0
2.44%
1 gen 1997 anni
21.0
-21.0
-50.0%
1 gen 1998 anni
42.0
+21.0
100.0%
1 gen 1999 anni
32.0
-10.0
-23.81%
1 gen 2000 anni
34.0
+2.0
6.25%
1 gen 2001 anni
21.0
-13.0
-38.24%
1 gen 2002 anni
21.0
0.0
0.0%
1 gen 2003 anni
21.0
0.0
0.0%
1 gen 2004 anni
43.0
+22.0
104.76%
1 gen 2005 anni
31.0
-12.0
-27.91%
1 gen 2006 anni
26.0
-5.0
-16.13%
1 gen 2007 anni
41.0
+15.0
57.69%
1 gen 2008 anni
64.0
+23.0
56.1%
1 gen 2009 anni
75.0
+11.0
17.19%
1 gen 2010 anni
42.0
-33.0
-44.0%
1 gen 2013 anni
11.0
-31.0
-73.81%
1 gen 2014 anni
15.0
+4.0
36.36%
1 gen 2015 anni
91.0
+76.0
506.67%
Classificazione dei paesi secondo i statistiche attuali per anni