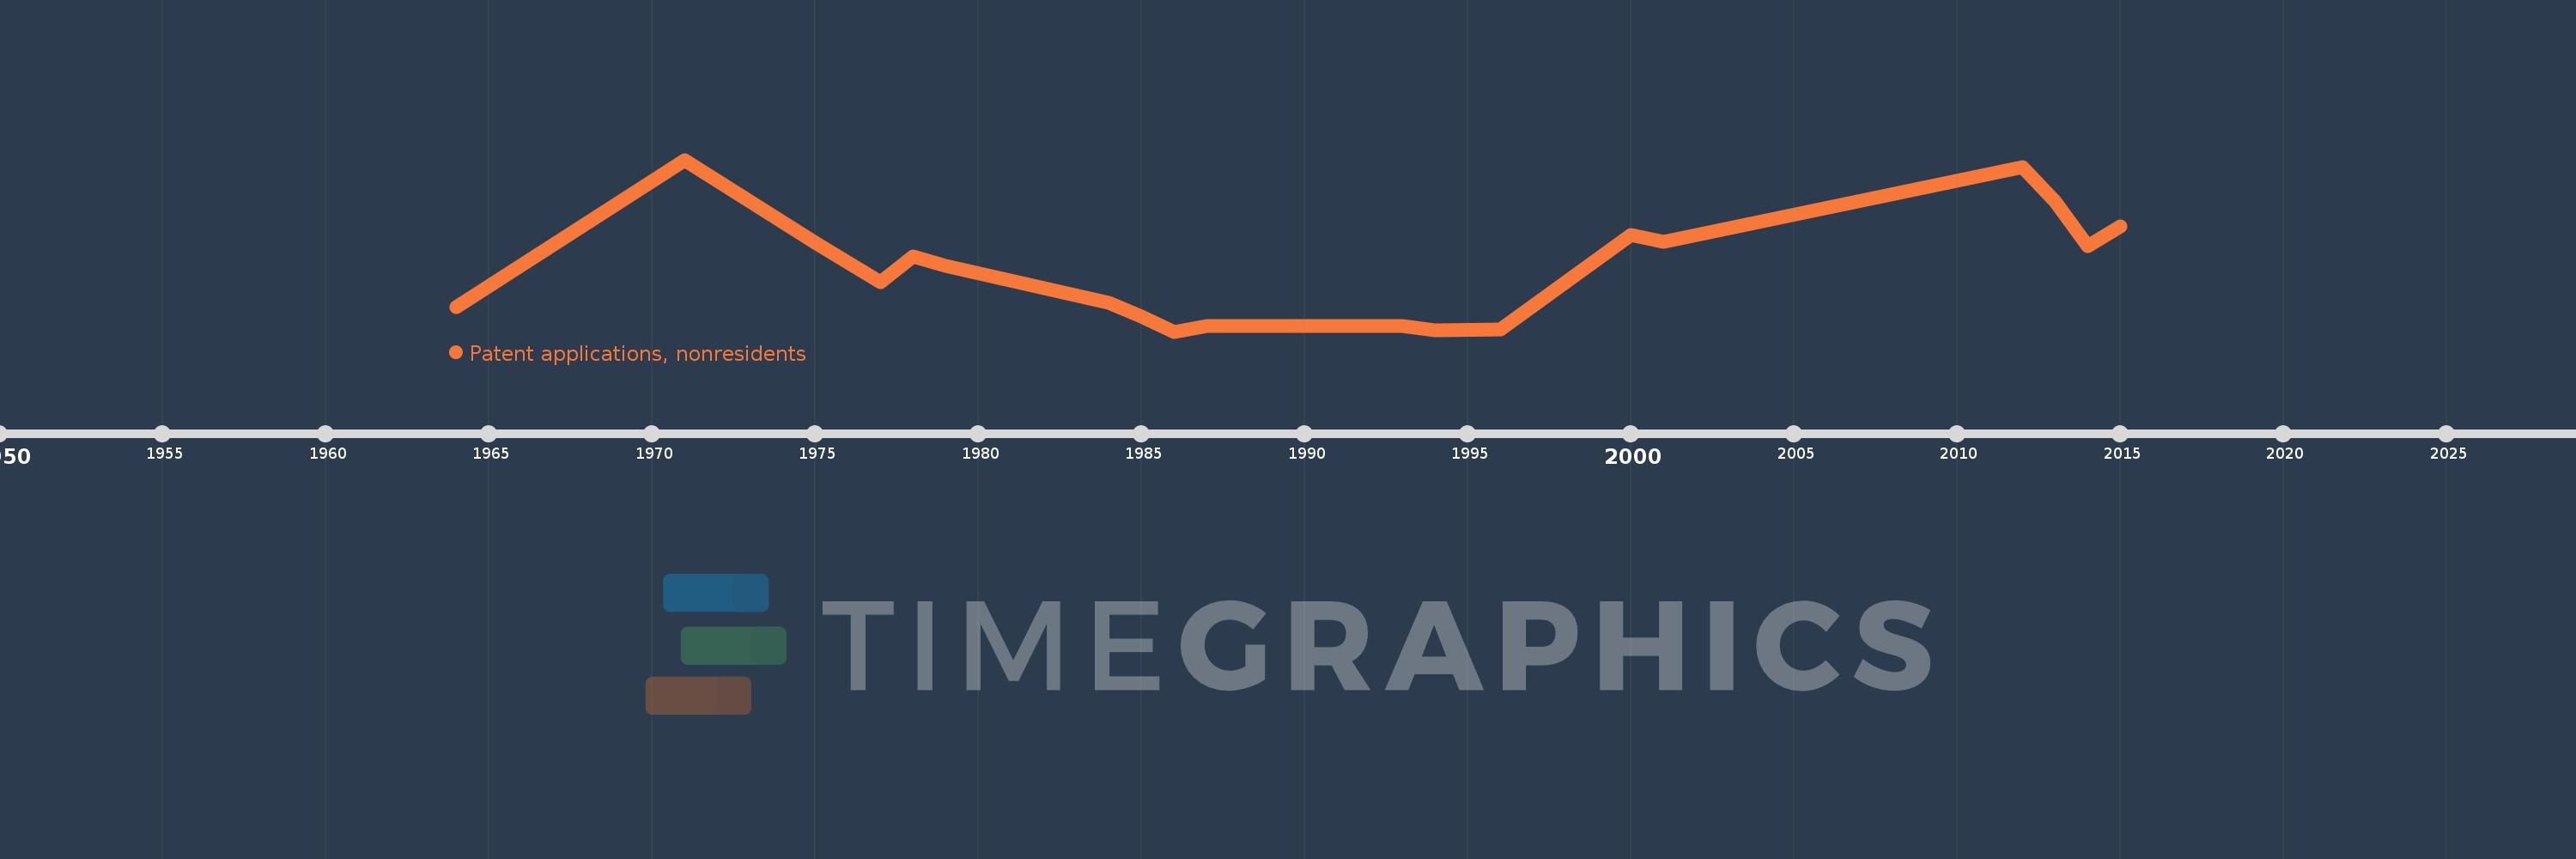
Questa scala temporale mostra un grafico dal 1964 anno al 2015 anno. Nicaragua. I dati fino ad 1963 anno non disponibili. Il numero di osservazioni attuali secondo i date: 19.
La fonte (nome):
Indicatori dello sviluppo mondiale
La fonte (organizzazione):
World Intellectual Property Organization (WIPO), WIPO Patent Report: Statistics on Worldwide Patent Activity. The International Bureau of WIPO assumes no responsibility with respect to the transformation of these data.
Categorie:
Science & Technology
sono stati aggiornati
23 apr 2017 anni
Indicatori delle variazioni dei valori per anni
In media:
100.632
Minima:
33.0
1 gen 1986 anni
Massimo:
216.0
1 gen 1971 anni
Alla data di osservazione
Valore
Variazione assoluta
La variazione rispetto al valore precedente
1 gen 1964 anni
59.0
+59.0
0.0%
1 gen 1971 anni
216.0
+157.0
266.1%
1 gen 1975 anni
128.0
-88.0
-40.74%
1 gen 1977 anni
86.0
-42.0
-32.81%
1 gen 1978 anni
113.0
+27.0
31.4%
1 gen 1979 anni
103.0
-10.0
-8.85%
1 gen 1984 anni
64.0
-39.0
-37.86%
1 gen 1985 anni
49.0
-15.0
-23.44%
1 gen 1986 anni
33.0
-16.0
-32.65%
1 gen 1987 anni
39.0
+6.0
18.18%
1 gen 1993 anni
39.0
0.0
0.0%
1 gen 1994 anni
34.0
-5.0
-12.82%
1 gen 1996 anni
35.0
+1.0
2.94%
1 gen 2000 anni
136.0
+101.0
288.57%
1 gen 2001 anni
129.0
-7.0
-5.15%
1 gen 2012 anni
208.0
+79.0
61.24%
1 gen 2013 anni
172.0
-36.0
-17.31%
1 gen 2014 anni
124.0
-48.0
-27.91%
1 gen 2015 anni
145.0
+21.0
16.94%
Classificazione dei paesi secondo i statistiche attuali per anni