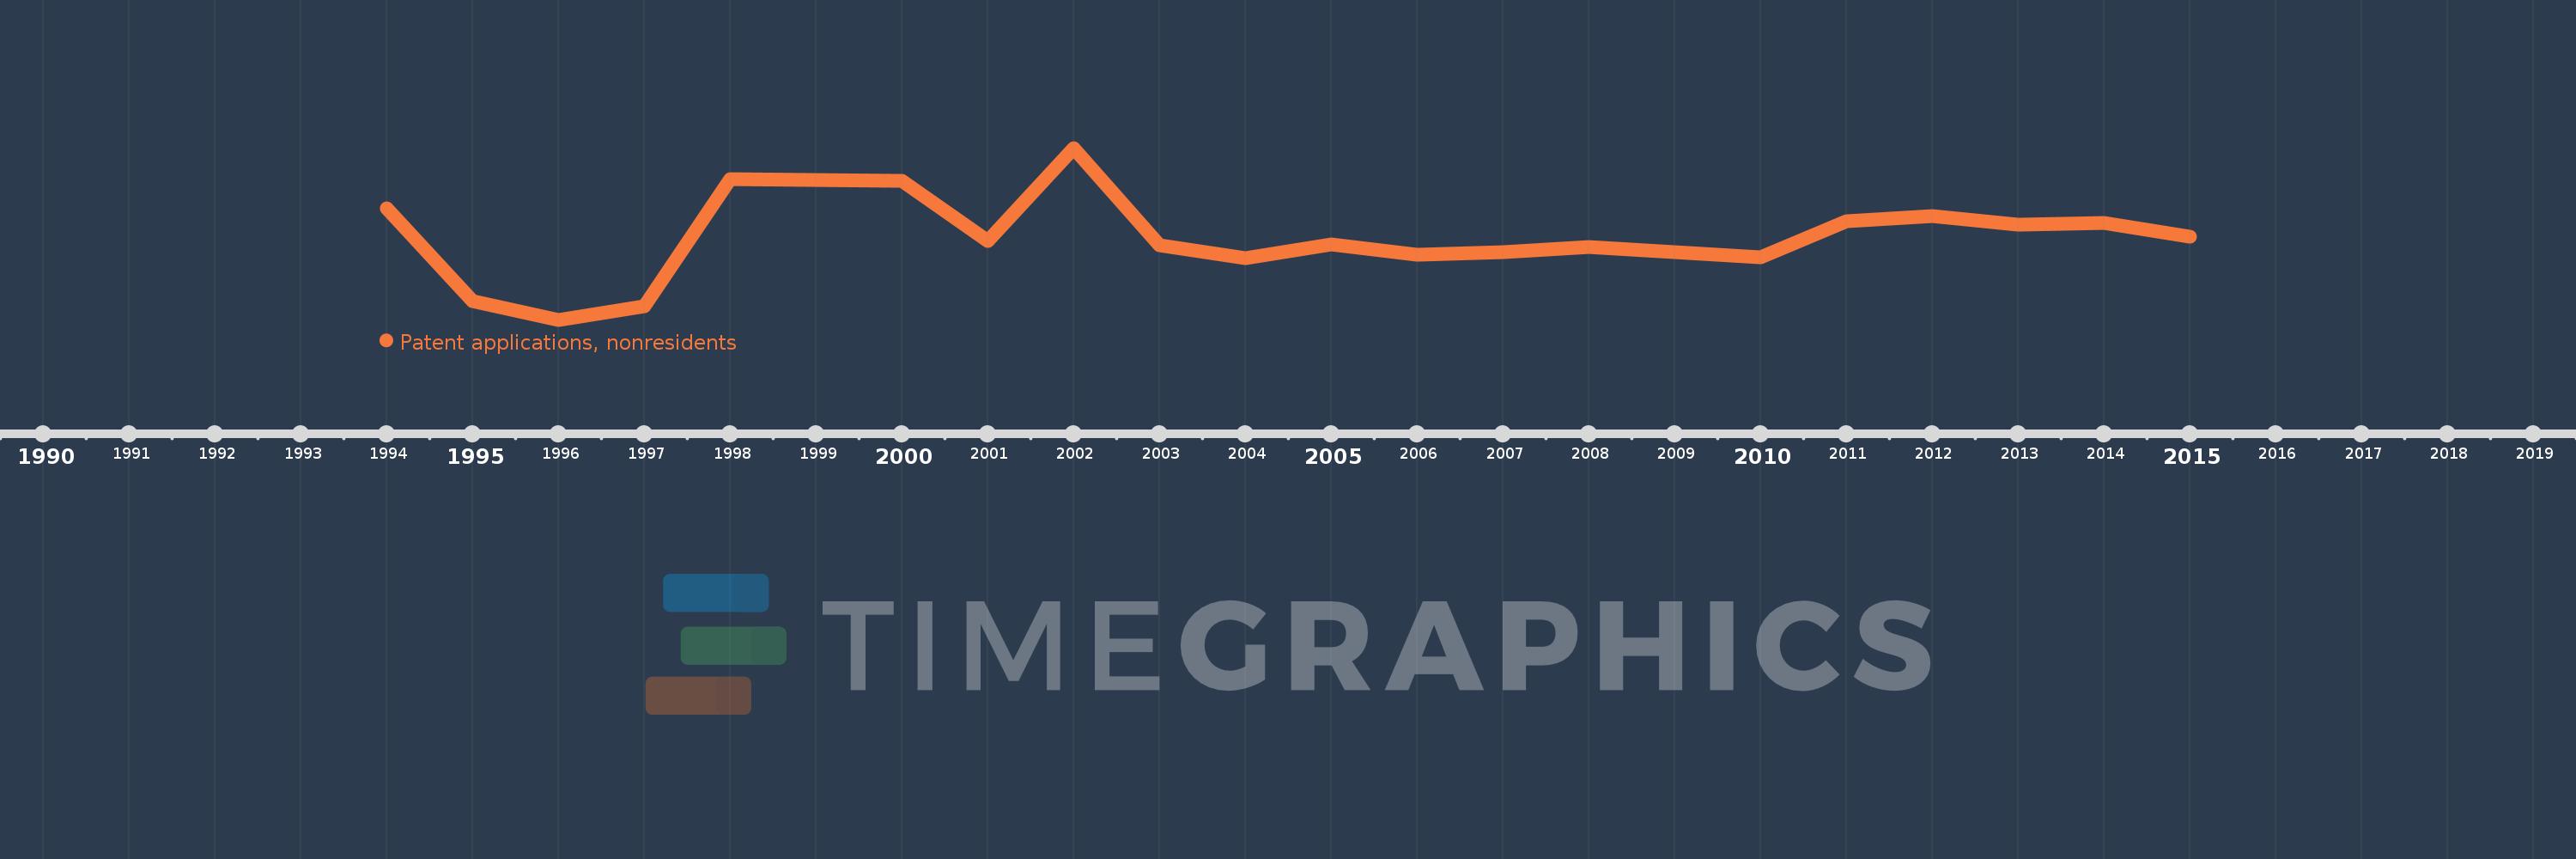
Questa scala temporale mostra un grafico dal 1994 anno al 2015 anno. Uzbekistan. I dati fino ad 1993 anno non disponibili. Il numero di osservazioni attuali secondo i date: 21.
La fonte (nome):
Indicatori dello sviluppo mondiale
La fonte (organizzazione):
World Intellectual Property Organization (WIPO), WIPO Patent Report: Statistics on Worldwide Patent Activity. The International Bureau of WIPO assumes no responsibility with respect to the transformation of these data.
Categorie:
Science & Technology
sono stati aggiornati
23 apr 2017 anni
Indicatori delle variazioni dei valori per anni
In media:
218.476
Minima:
19.0
1 gen 1996 anni
Massimo:
443.0
1 gen 2002 anni
Alla data di osservazione
Valore
Variazione assoluta
La variazione rispetto al valore precedente
1 gen 1994 anni
295.0
+295.0
0.0%
1 gen 1995 anni
64.0
-231.0
-78.31%
1 gen 1996 anni
19.0
-45.0
-70.31%
1 gen 1997 anni
53.0
+34.0
178.95%
1 gen 1998 anni
367.0
+314.0
592.45%
1 gen 2000 anni
361.0
-6.0
-1.63%
1 gen 2001 anni
213.0
-148.0
-41.0%
1 gen 2002 anni
443.0
+230.0
107.98%
1 gen 2003 anni
203.0
-240.0
-54.18%
1 gen 2004 anni
171.0
-32.0
-15.76%
1 gen 2005 anni
205.0
+34.0
19.88%
1 gen 2006 anni
180.0
-25.0
-12.2%
1 gen 2007 anni
186.0
+6.0
3.33%
1 gen 2008 anni
198.0
+12.0
6.45%
1 gen 2009 anni
186.0
-12.0
-6.06%
1 gen 2010 anni
174.0
-12.0
-6.45%
1 gen 2011 anni
262.0
+88.0
50.57%
1 gen 2012 anni
274.0
+12.0
4.58%
1 gen 2013 anni
253.0
-21.0
-7.66%
1 gen 2014 anni
258.0
+5.0
1.98%
1 gen 2015 anni
223.0
-35.0
-13.57%
Classificazione dei paesi secondo i statistiche attuali per anni