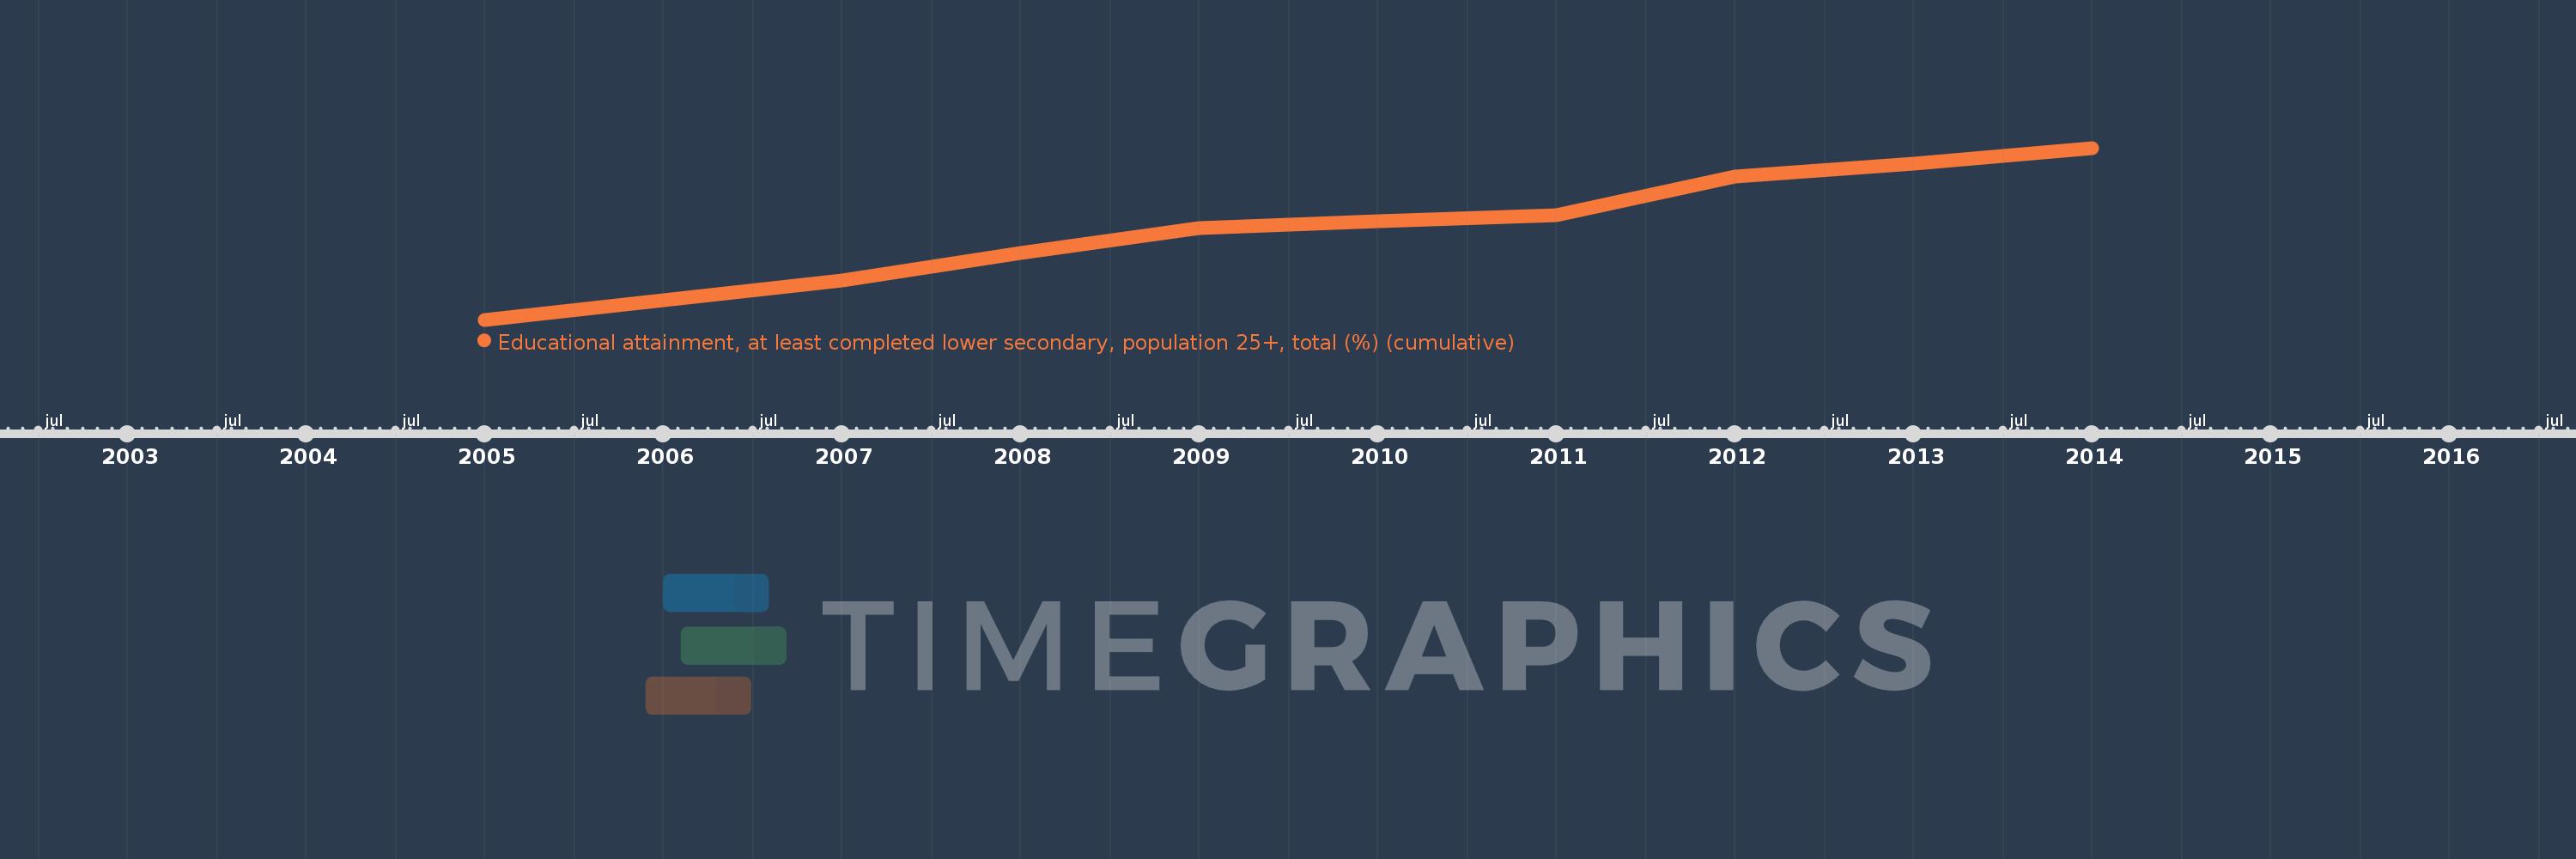
Questa scala temporale mostra un grafico dal 2005 anno al 2014 anno. Brazil. I dati fino ad 2004 anno non disponibili. Il numero di osservazioni attuali secondo i date: 9.
La fonte (nome):
Indicatori dello sviluppo mondiale
La fonte (organizzazione):
United Nations Educational, Scientific, and Cultural Organization (UNESCO) Institute for Statistics.
Categorie:
Education, Gender
sono stati aggiornati
23 apr 2017 anni
Indicatori delle variazioni dei valori per anni
In media:
49.979
Minima:
42.408
1 gen 2005 anni
Massimo:
55.844
1 gen 2014 anni
Alla data di osservazione
Valore
Variazione assoluta
La variazione rispetto al valore precedente
1 gen 2005 anni
42.408
+42.408
0.0%
1 gen 2007 anni
45.456
+3.048
7.19%
1 gen 2008 anni
47.608
+2.152
4.73%
1 gen 2009 anni
49.549
+1.941
4.08%
1 gen 2010 anni
50.099
+0.551
1.11%
1 gen 2011 anni
50.615
+0.516
1.03%
1 gen 2012 anni
53.598
+2.983
5.89%
1 gen 2013 anni
54.634
+1.036
1.93%
1 gen 2014 anni
55.844
+1.21
2.22%
Classificazione dei paesi secondo i statistiche attuali per anni