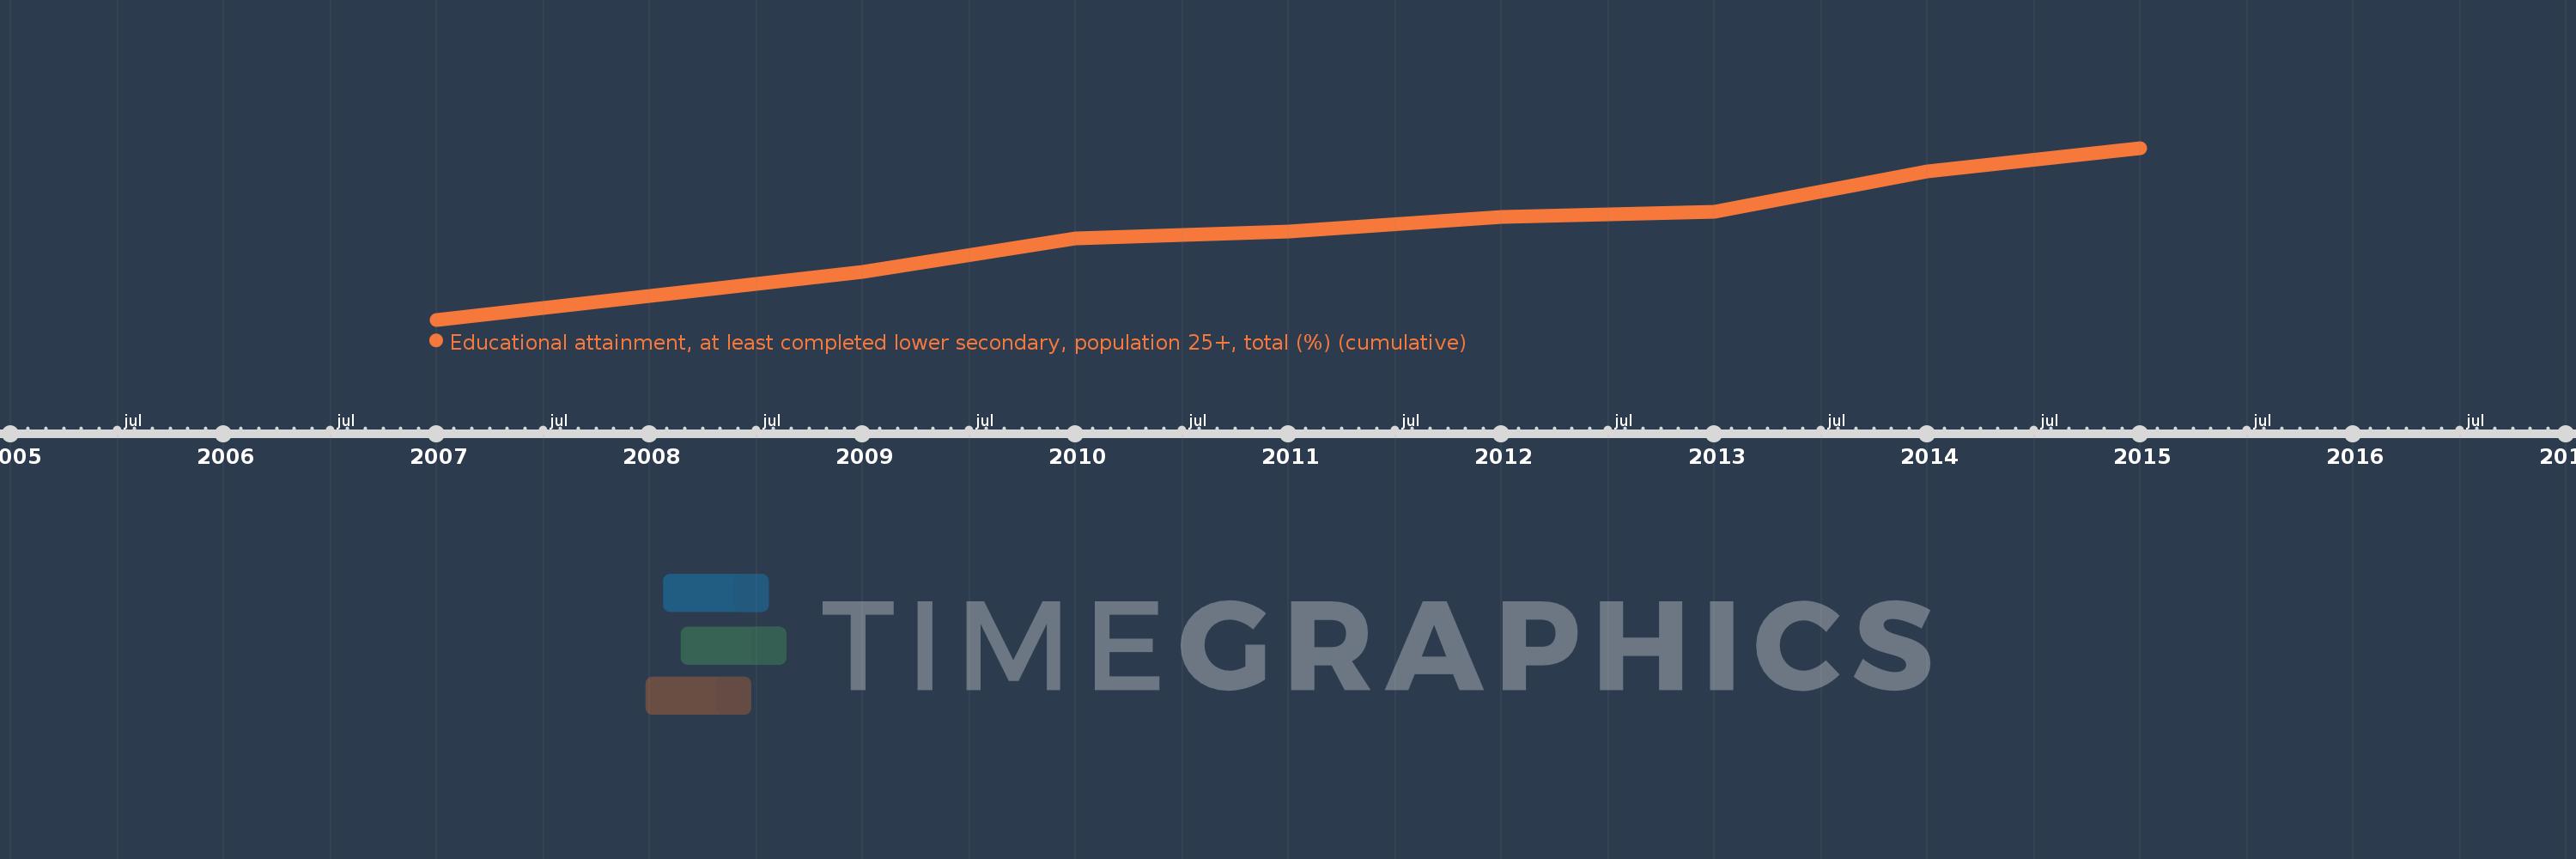
Questa scala temporale mostra un grafico dal 2007 anno al 2015 anno. Belgium. I dati fino ad 2006 anno non disponibili. Il numero di osservazioni attuali secondo i date: 8.
La fonte (nome):
Indicatori dello sviluppo mondiale
La fonte (organizzazione):
United Nations Educational, Scientific, and Cultural Organization (UNESCO) Institute for Statistics.
Categorie:
Education, Gender
sono stati aggiornati
23 apr 2017 anni
Indicatori delle variazioni dei valori per anni
In media:
79.813
Minima:
76.787
1 gen 2007 anni
Massimo:
82.341
1 gen 2015 anni
Alla data di osservazione
Valore
Variazione assoluta
La variazione rispetto al valore precedente
1 gen 2007 anni
76.787
+76.787
0.0%
1 gen 2009 anni
78.324
+1.536
2.0%
1 gen 2010 anni
79.43
+1.106
1.41%
1 gen 2011 anni
79.641
+0.212
0.27%
1 gen 2012 anni
80.101
+0.46
0.58%
1 gen 2013 anni
80.29
+0.189
0.24%
1 gen 2014 anni
81.588
+1.298
1.62%
1 gen 2015 anni
82.341
+0.753
0.92%
Classificazione dei paesi secondo i statistiche attuali per anni