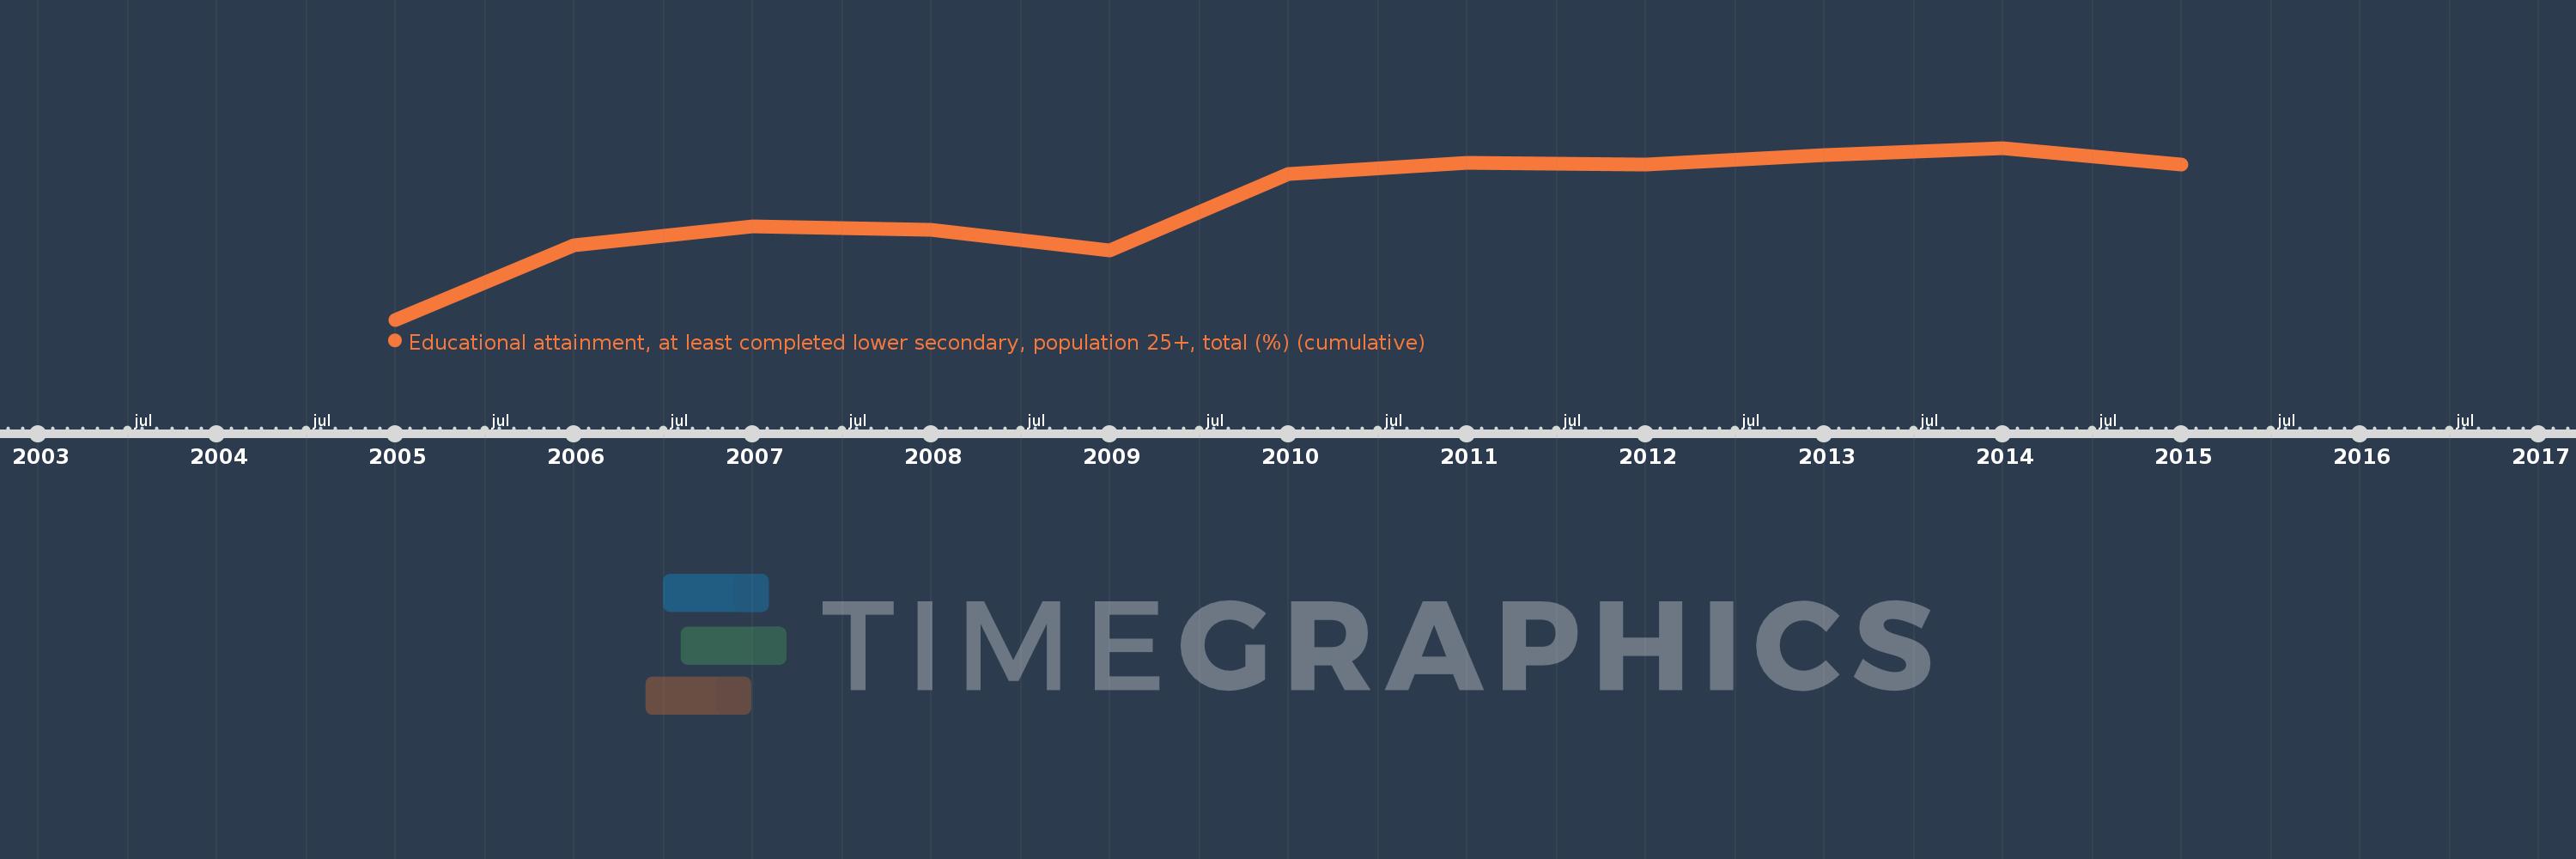
Questa scala temporale mostra un grafico dal 2005 anno al 2015 anno. Latvia. I dati fino ad 2004 anno non disponibili. Il numero di osservazioni attuali secondo i date: 11.
La fonte (nome):
Indicatori dello sviluppo mondiale
La fonte (organizzazione):
United Nations Educational, Scientific, and Cultural Organization (UNESCO) Institute for Statistics.
Categorie:
Education, Gender
sono stati aggiornati
23 apr 2017 anni
Indicatori delle variazioni dei valori per anni
In media:
98.561
Minima:
96.976
1 gen 2005 anni
Massimo:
99.321
1 gen 2014 anni
Alla data di osservazione
Valore
Variazione assoluta
La variazione rispetto al valore precedente
1 gen 2005 anni
96.976
+96.976
0.0%
1 gen 2006 anni
97.997
+1.022
1.05%
1 gen 2007 anni
98.254
+0.257
0.26%
1 gen 2008 anni
98.2
-0.054
-0.05%
1 gen 2009 anni
97.921
-0.28
-0.28%
1 gen 2010 anni
98.963
+1.043
1.06%
1 gen 2011 anni
99.118
+0.155
0.16%
1 gen 2012 anni
99.097
-0.022
-0.02%
1 gen 2013 anni
99.224
+0.128
0.13%
1 gen 2014 anni
99.321
+0.097
0.1%
1 gen 2015 anni
99.096
-0.225
-0.23%
Classificazione dei paesi secondo i statistiche attuali per anni