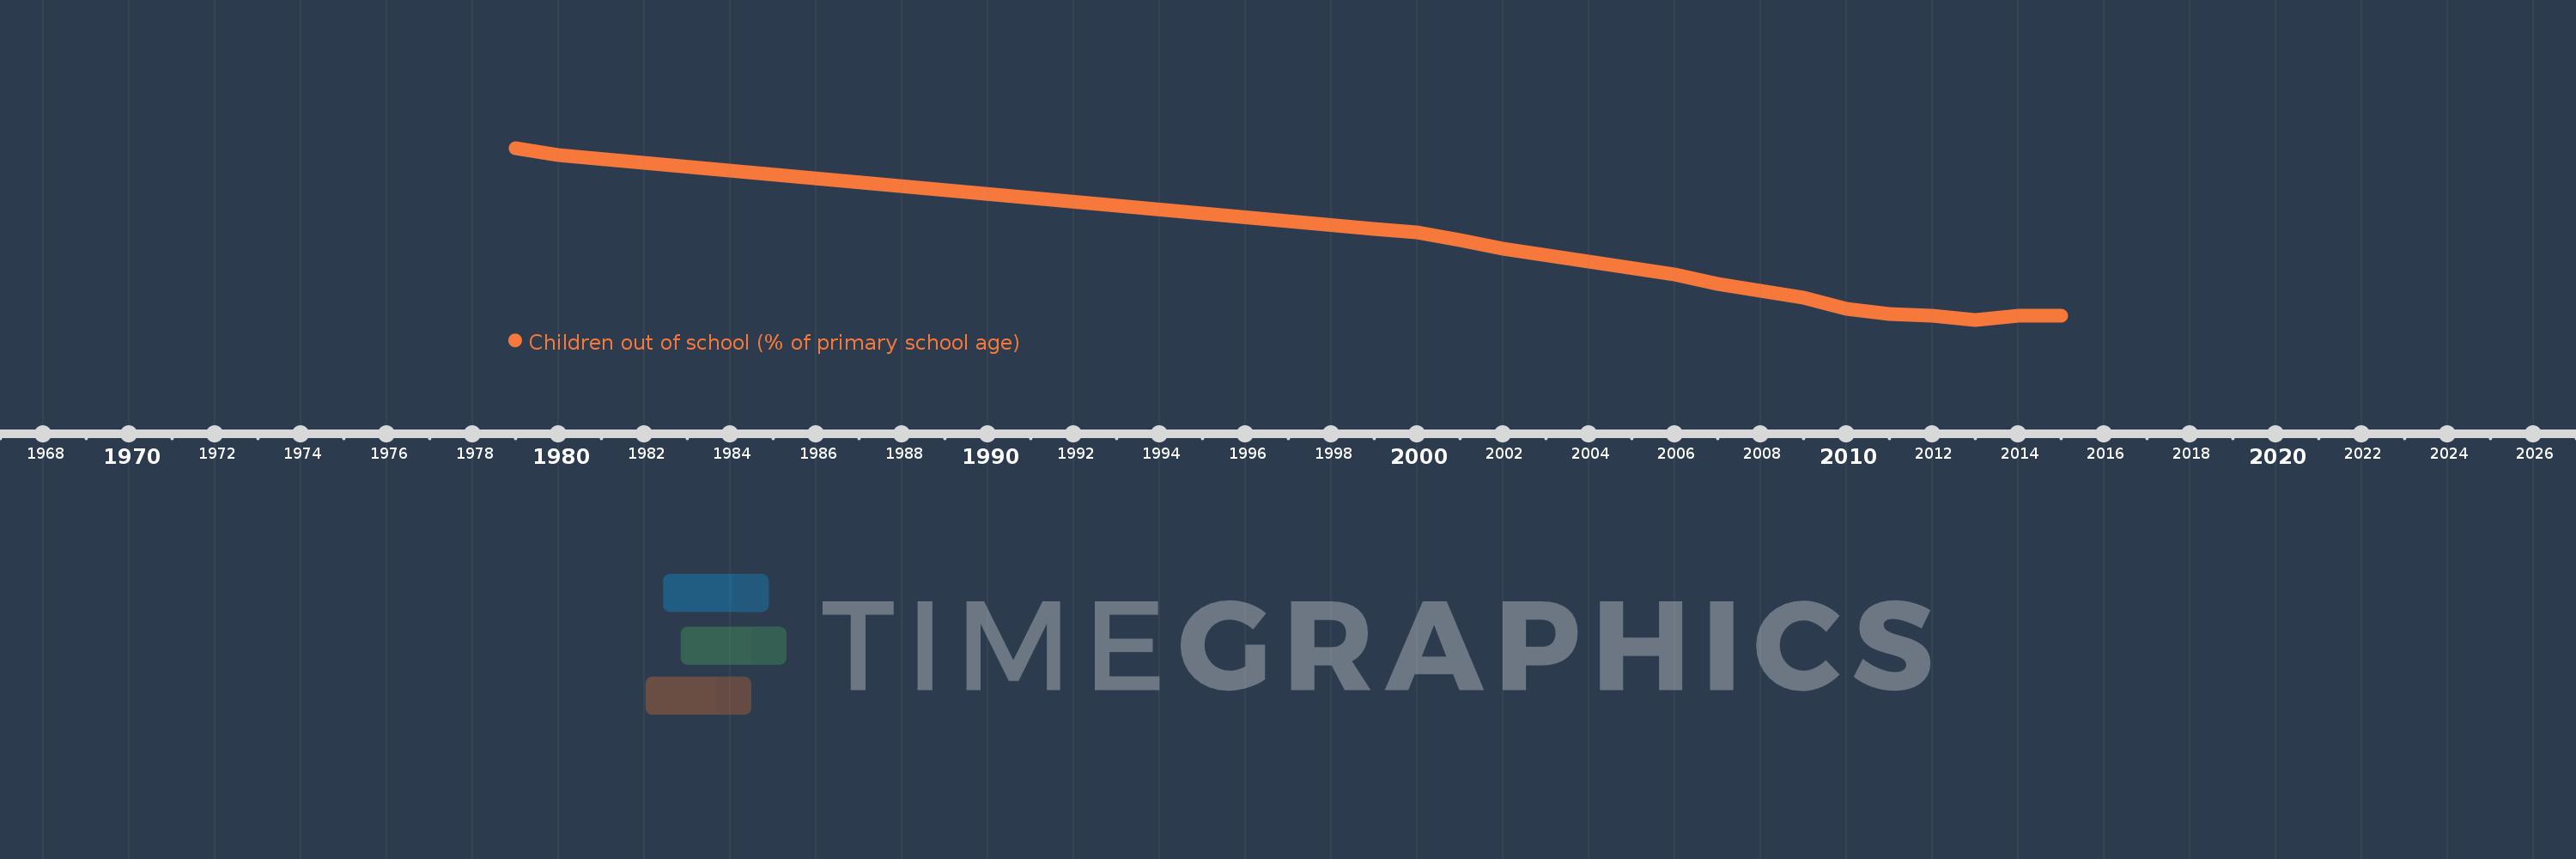
Questa scala temporale mostra un grafico dal 1979 anno al 2015 anno. Bhutan. I dati fino ad 1978 anno non disponibili. Il numero di osservazioni attuali secondo i date: 15.
La fonte (nome):
Indicatori dello sviluppo mondiale
La fonte (organizzazione):
United Nations Educational, Scientific, and Cultural Organization (UNESCO) Institute for Statistics.
Categorie:
Education
sono stati aggiornati
23 apr 2017 anni
Indicatori delle variazioni dei valori per anni
In media:
30.257
Minima:
9.282
1 gen 2013 anni
Massimo:
77.186
1 gen 1979 anni
Alla data di osservazione
Valore
Variazione assoluta
La variazione rispetto al valore precedente
1 gen 1979 anni
77.186
+77.186
0.0%
1 gen 1980 anni
74.391
-2.794
-3.62%
1 gen 1999 anni
45.006
-29.385
-39.5%
1 gen 2000 anni
43.864
-1.142
-2.54%
1 gen 2001 anni
40.834
-3.03
-6.91%
1 gen 2002 anni
37.29
-3.544
-8.68%
1 gen 2006 anni
27.06
-10.23
-27.43%
1 gen 2007 anni
23.276
-3.783
-13.98%
1 gen 2009 anni
17.936
-5.34
-22.94%
1 gen 2010 anni
13.485
-4.451
-24.81%
1 gen 2011 anni
11.508
-1.977
-14.66%
1 gen 2012 anni
10.882
-0.626
-5.44%
1 gen 2013 anni
9.282
-1.601
-14.71%
1 gen 2014 anni
10.838
+1.556
16.77%
1 gen 2015 anni
11.017
+0.179
1.66%
Classificazione dei paesi secondo i statistiche attuali per anni