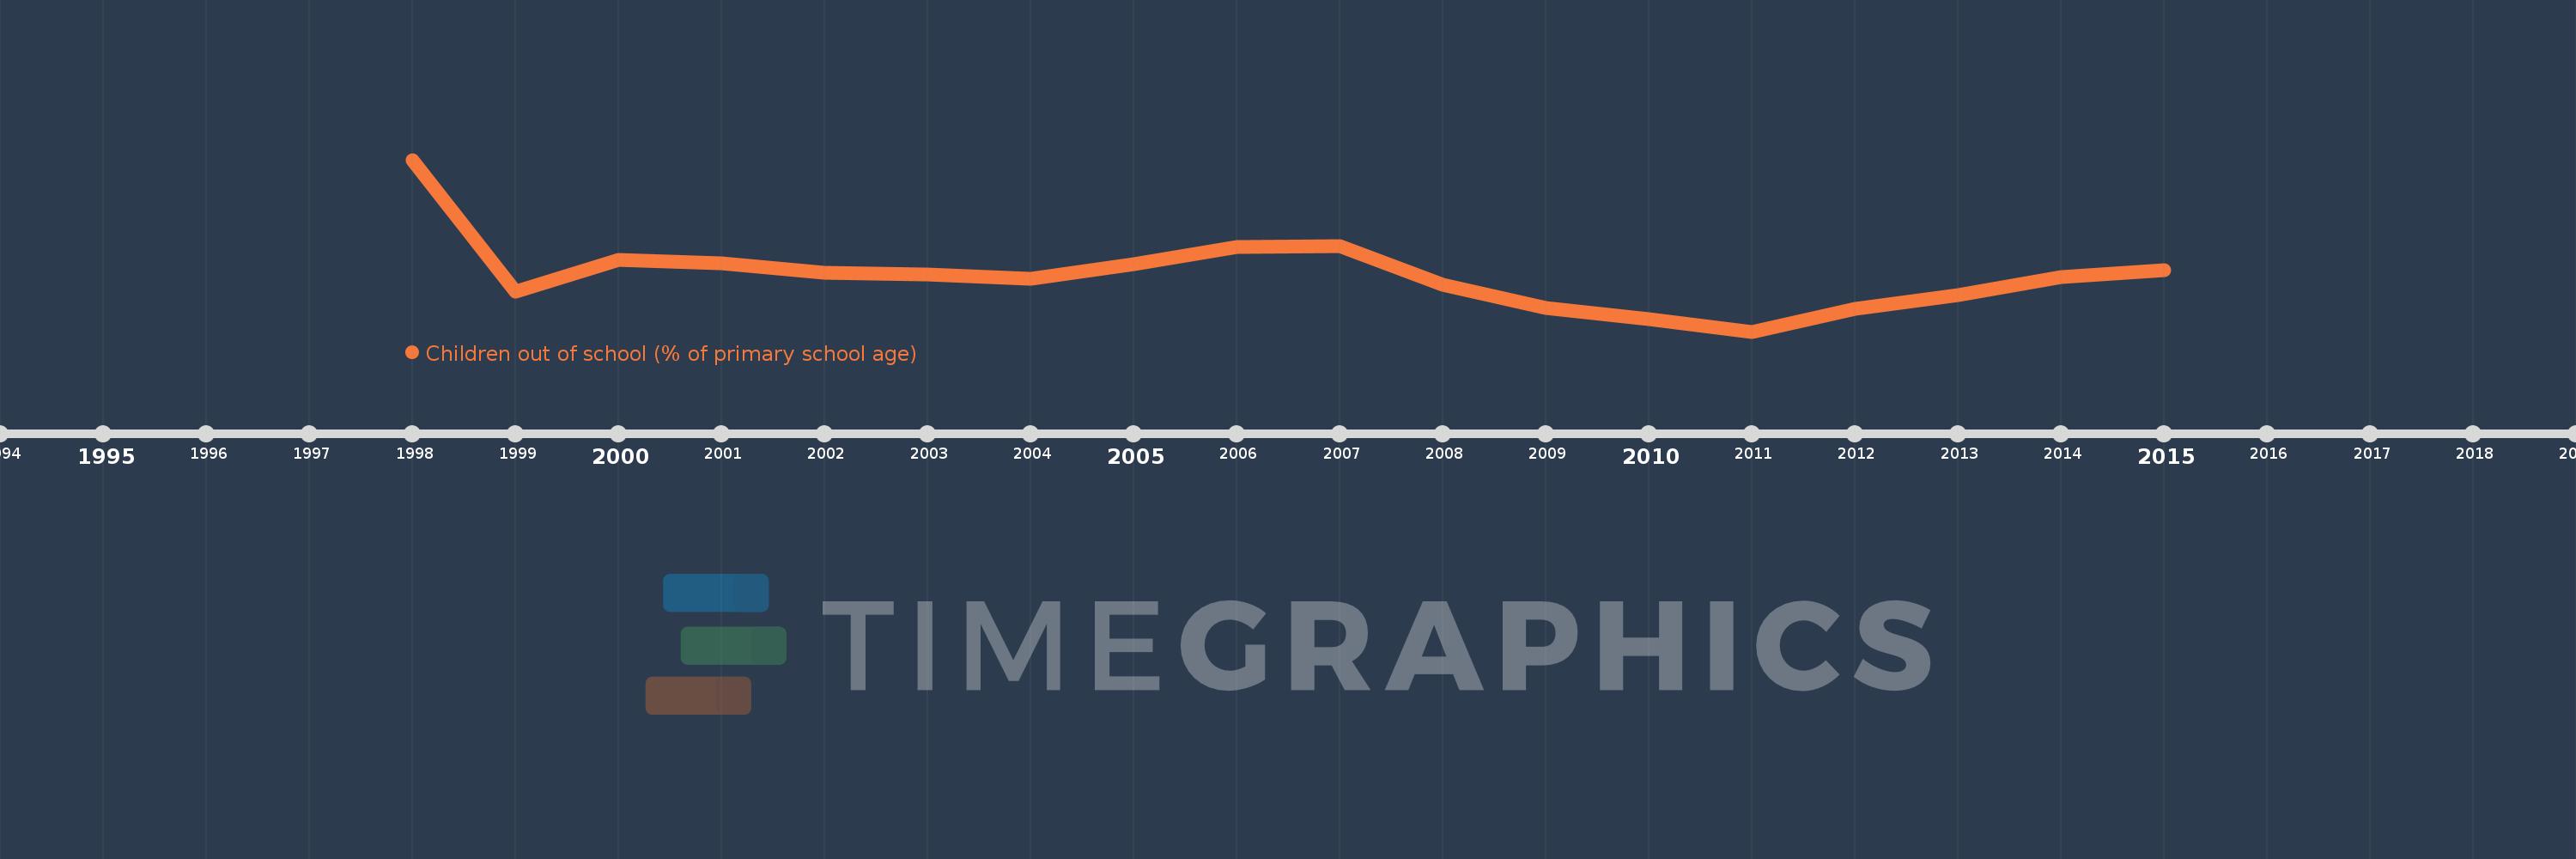
Questa scala temporale mostra un grafico dal 1998 anno al 2015 anno. Central Europe and the Baltics. I dati fino ad 1997 anno non disponibili. Il numero di osservazioni attuali secondo i date: 18.
La fonte (nome):
Indicatori dello sviluppo mondiale
La fonte (organizzazione):
United Nations Educational, Scientific, and Cultural Organization (UNESCO) Institute for Statistics.
Categorie:
Education
sono stati aggiornati
23 apr 2017 anni
Indicatori delle variazioni dei valori per anni
In media:
4.156
Minima:
3.102
1 gen 2011 anni
Massimo:
6.305
1 gen 1998 anni
Alla data di osservazione
Valore
Variazione assoluta
La variazione rispetto al valore precedente
1 gen 1998 anni
6.305
+6.305
0.0%
1 gen 1999 anni
3.853
-2.452
-38.9%
1 gen 2000 anni
4.436
+0.583
15.14%
1 gen 2001 anni
4.372
-0.064
-1.43%
1 gen 2002 anni
4.205
-0.168
-3.83%
1 gen 2003 anni
4.167
-0.038
-0.9%
1 gen 2004 anni
4.094
-0.073
-1.75%
1 gen 2005 anni
4.353
+0.259
6.32%
1 gen 2006 anni
4.686
+0.333
7.65%
1 gen 2007 anni
4.698
+0.013
0.27%
1 gen 2008 anni
3.974
-0.725
-15.42%
1 gen 2009 anni
3.541
-0.433
-10.88%
1 gen 2010 anni
3.337
-0.204
-5.77%
1 gen 2011 anni
3.102
-0.235
-7.05%
1 gen 2012 anni
3.524
+0.423
13.63%
1 gen 2013 anni
3.79
+0.265
7.52%
1 gen 2014 anni
4.12
+0.331
8.73%
1 gen 2015 anni
4.244
+0.123
2.99%
Classificazione dei paesi secondo i statistiche attuali per anni