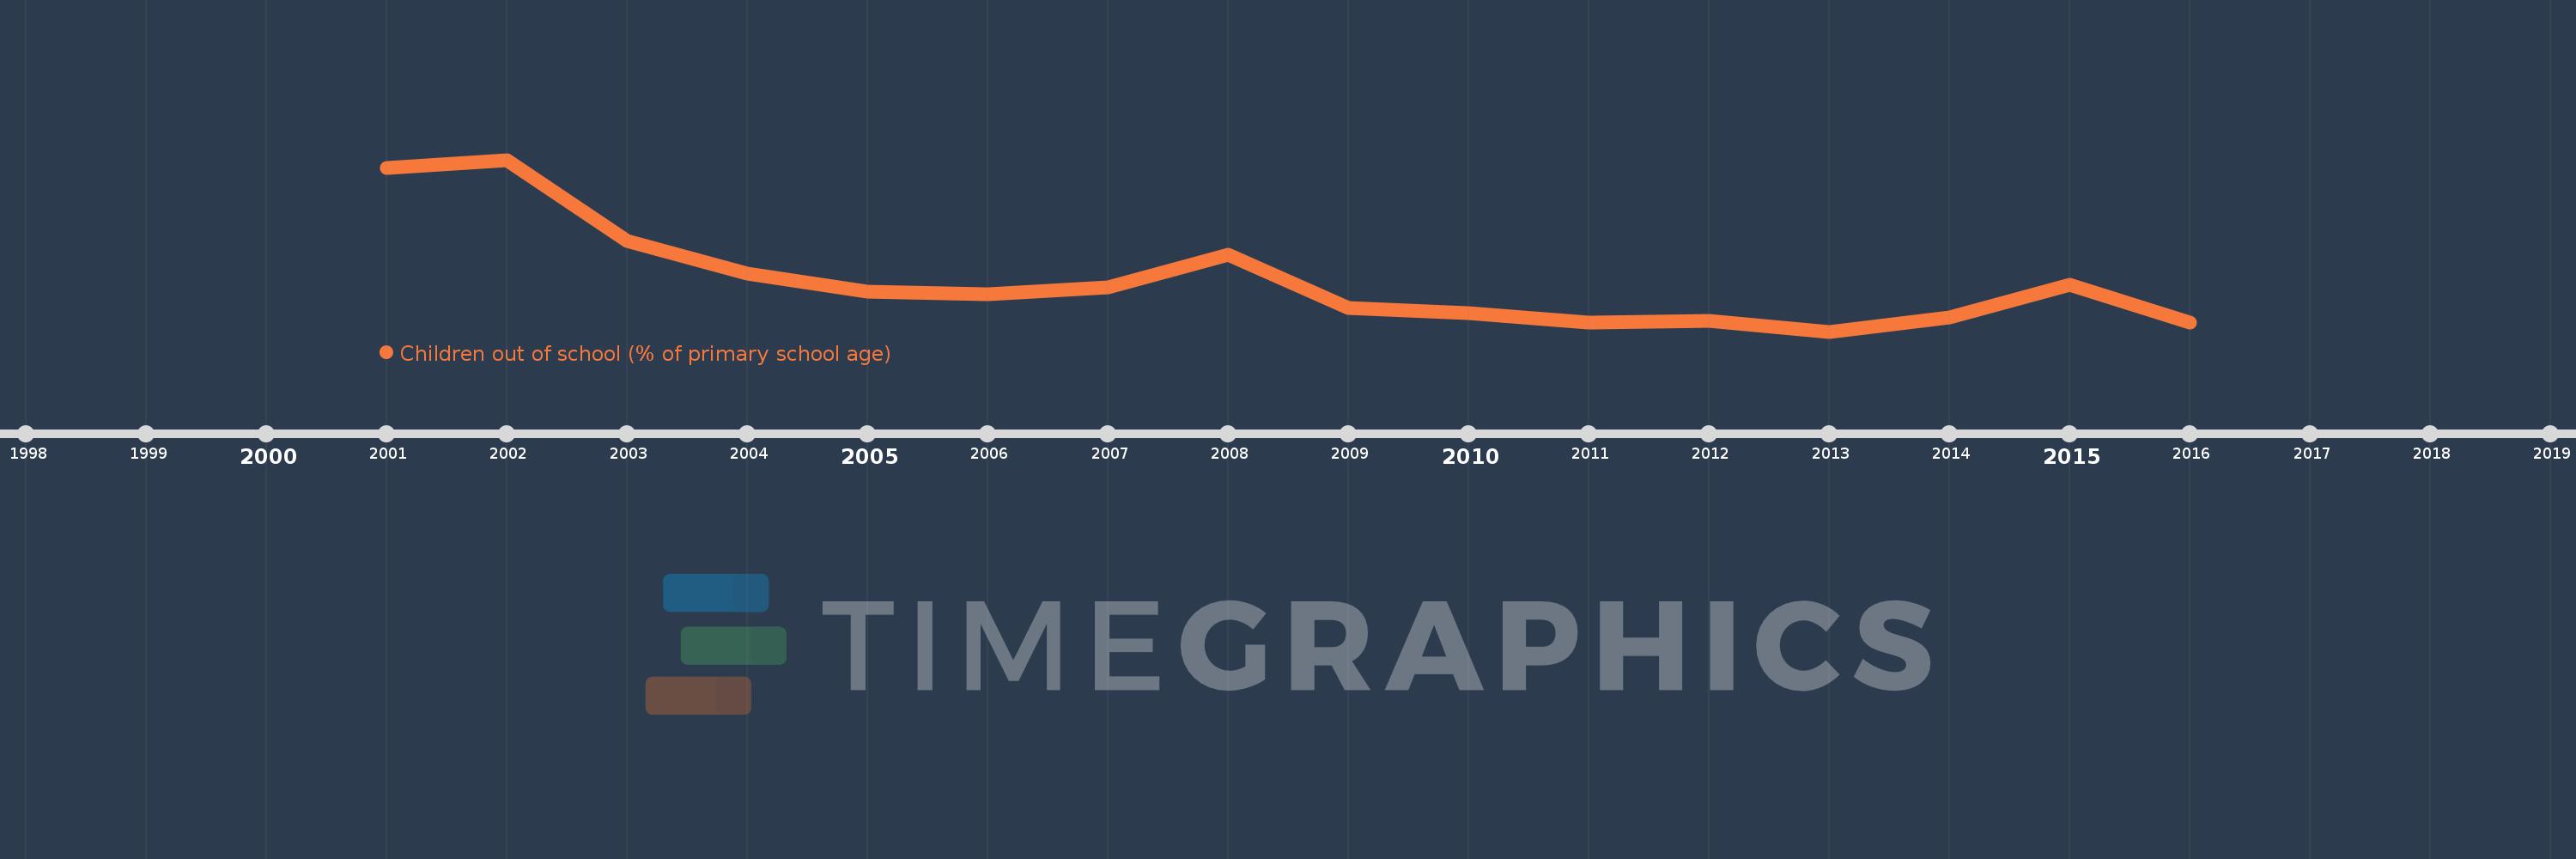
Questa scala temporale mostra un grafico dal 2001 anno al 2016 anno. Tajikistan. I dati fino ad 2000 anno non disponibili. Il numero di osservazioni attuali secondo i date: 16.
La fonte (nome):
Indicatori dello sviluppo mondiale
La fonte (organizzazione):
United Nations Educational, Scientific, and Cultural Organization (UNESCO) Institute for Statistics.
Categorie:
Education
sono stati aggiornati
23 apr 2017 anni
Indicatori delle variazioni dei valori per anni
In media:
2.877
Minima:
1.667
1 gen 2013 anni
Massimo:
5.74
1 gen 2002 anni
Alla data di osservazione
Valore
Variazione assoluta
La variazione rispetto al valore precedente
1 gen 2001 anni
5.546
+5.546
0.0%
1 gen 2002 anni
5.74
+0.194
3.5%
1 gen 2003 anni
3.811
-1.929
-33.6%
1 gen 2004 anni
3.043
-0.768
-20.15%
1 gen 2005 anni
2.624
-0.419
-13.77%
1 gen 2006 anni
2.56
-0.064
-2.43%
1 gen 2007 anni
2.717
+0.157
6.12%
1 gen 2008 anni
3.498
+0.781
28.76%
1 gen 2009 anni
2.233
-1.265
-36.15%
1 gen 2010 anni
2.114
-0.119
-5.33%
1 gen 2011 anni
1.891
-0.223
-10.56%
1 gen 2012 anni
1.93
+0.038
2.03%
1 gen 2013 anni
1.667
-0.263
-13.61%
1 gen 2014 anni
1.996
+0.329
19.77%
1 gen 2015 anni
2.777
+0.78
39.08%
1 gen 2016 anni
1.887
-0.89
-32.04%
Classificazione dei paesi secondo i statistiche attuali per anni