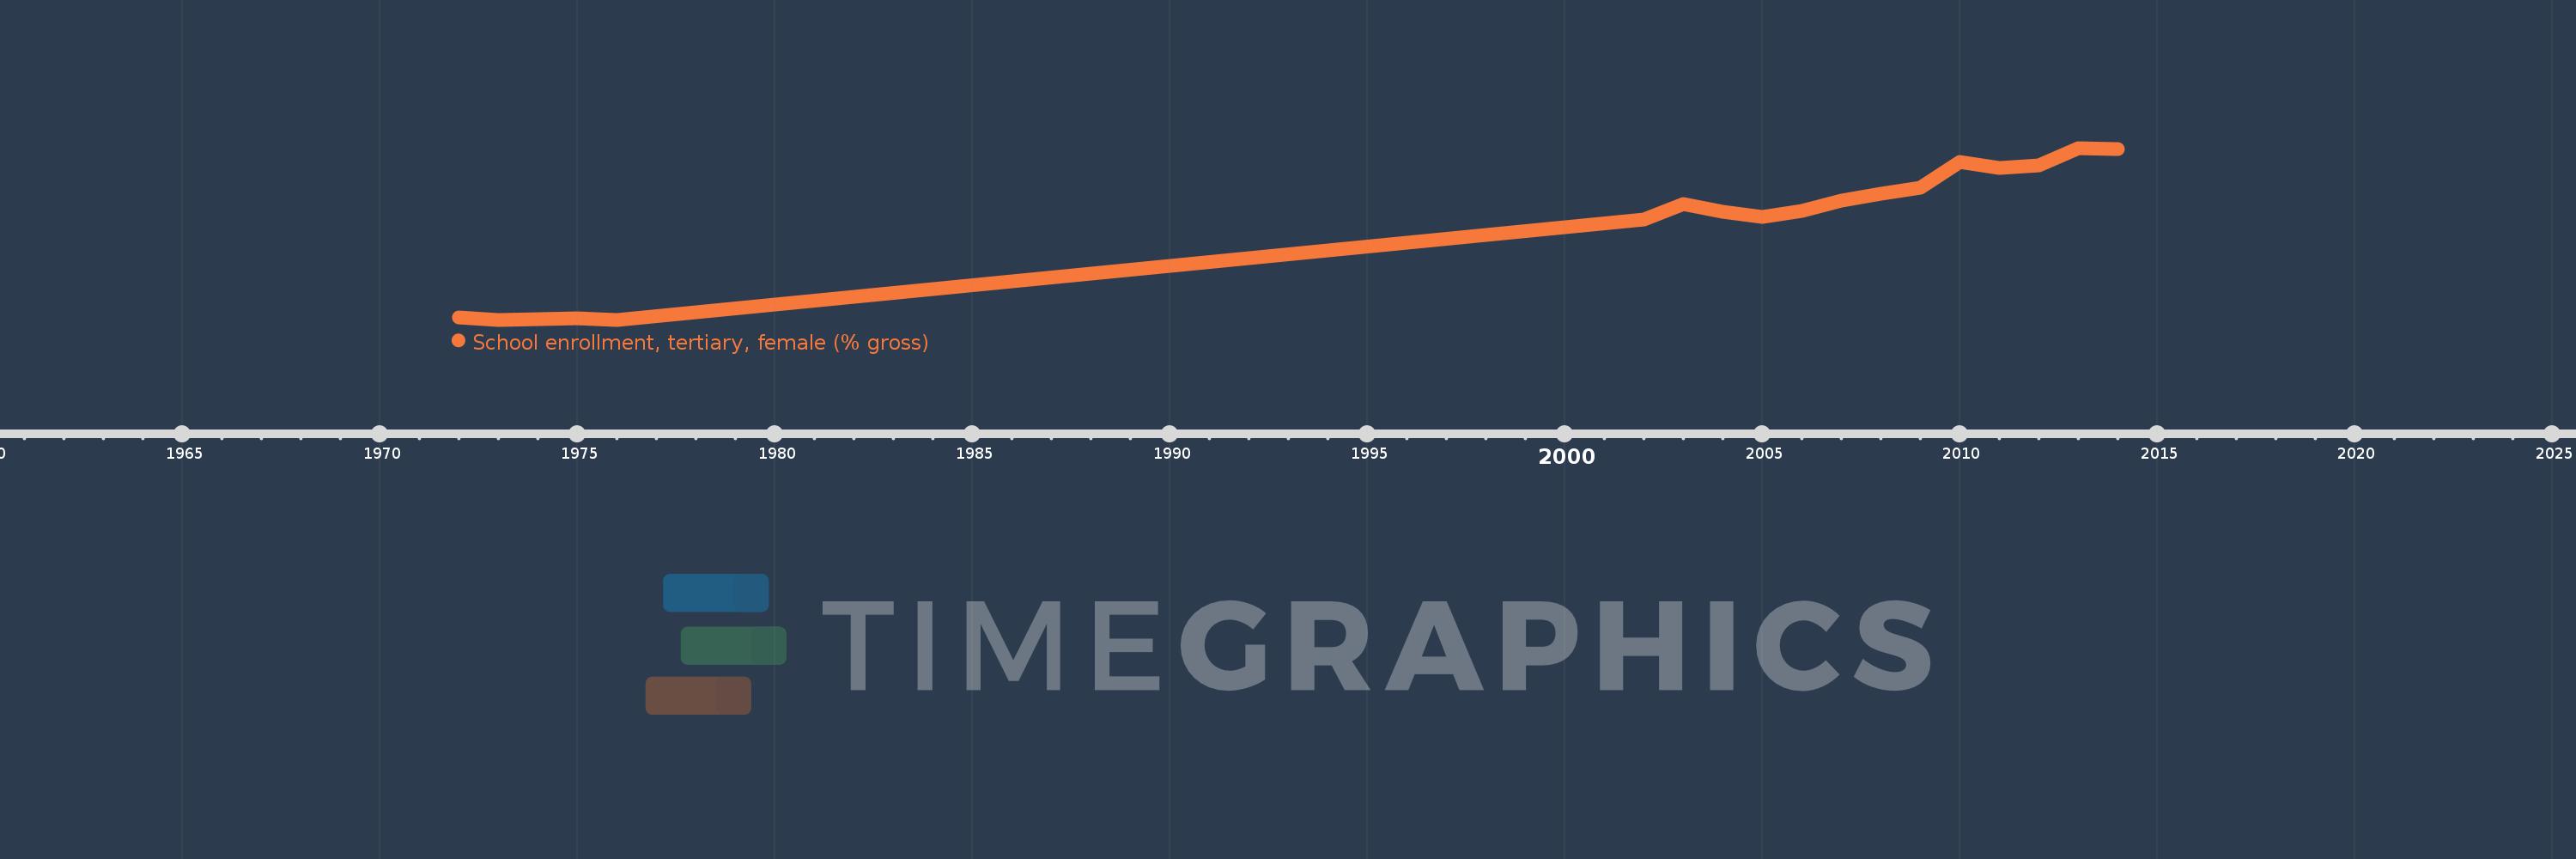
Questa scala temporale mostra un grafico dal 1972 anno al 2014 anno. Belize. I dati fino ad 1971 anno non disponibili. Il numero di osservazioni attuali secondo i date: 17.
La fonte (nome):
Indicatori dello sviluppo mondiale
La fonte (organizzazione):
United Nations Educational, Scientific, and Cultural Organization (UNESCO) Institute for Statistics.
Categorie:
Education, Gender
sono stati aggiornati
23 apr 2017 anni
Indicatori delle variazioni dei valori per anni
In media:
18.326
Minima:
1.117
1 gen 1976 anni
Massimo:
30.306
1 gen 2013 anni
Alla data di osservazione
Valore
Variazione assoluta
La variazione rispetto al valore precedente
1 gen 1972 anni
1.455
+1.455
0.0%
1 gen 1973 anni
1.119
-0.336
-23.09%
1 gen 1975 anni
1.315
+0.196
17.47%
1 gen 1976 anni
1.117
-0.198
-15.05%
1 gen 2002 anni
18.191
+17.074
1.53 Mille.%
1 gen 2003 anni
20.713
+2.522
13.86%
1 gen 2004 anni
19.429
-1.284
-6.2%
1 gen 2005 anni
18.585
-0.844
-4.35%
1 gen 2006 anni
19.654
+1.069
5.75%
1 gen 2007 anni
21.322
+1.668
8.49%
1 gen 2008 anni
22.576
+1.254
5.88%
1 gen 2009 anni
23.555
+0.979
4.34%
1 gen 2010 anni
27.965
+4.41
18.72%
1 gen 2011 anni
26.87
-1.096
-3.92%
1 gen 2012 anni
27.319
+0.45
1.67%
1 gen 2013 anni
30.306
+2.987
10.93%
1 gen 2014 anni
30.049
-0.258
-0.85%
Classificazione dei paesi secondo i statistiche attuali per anni