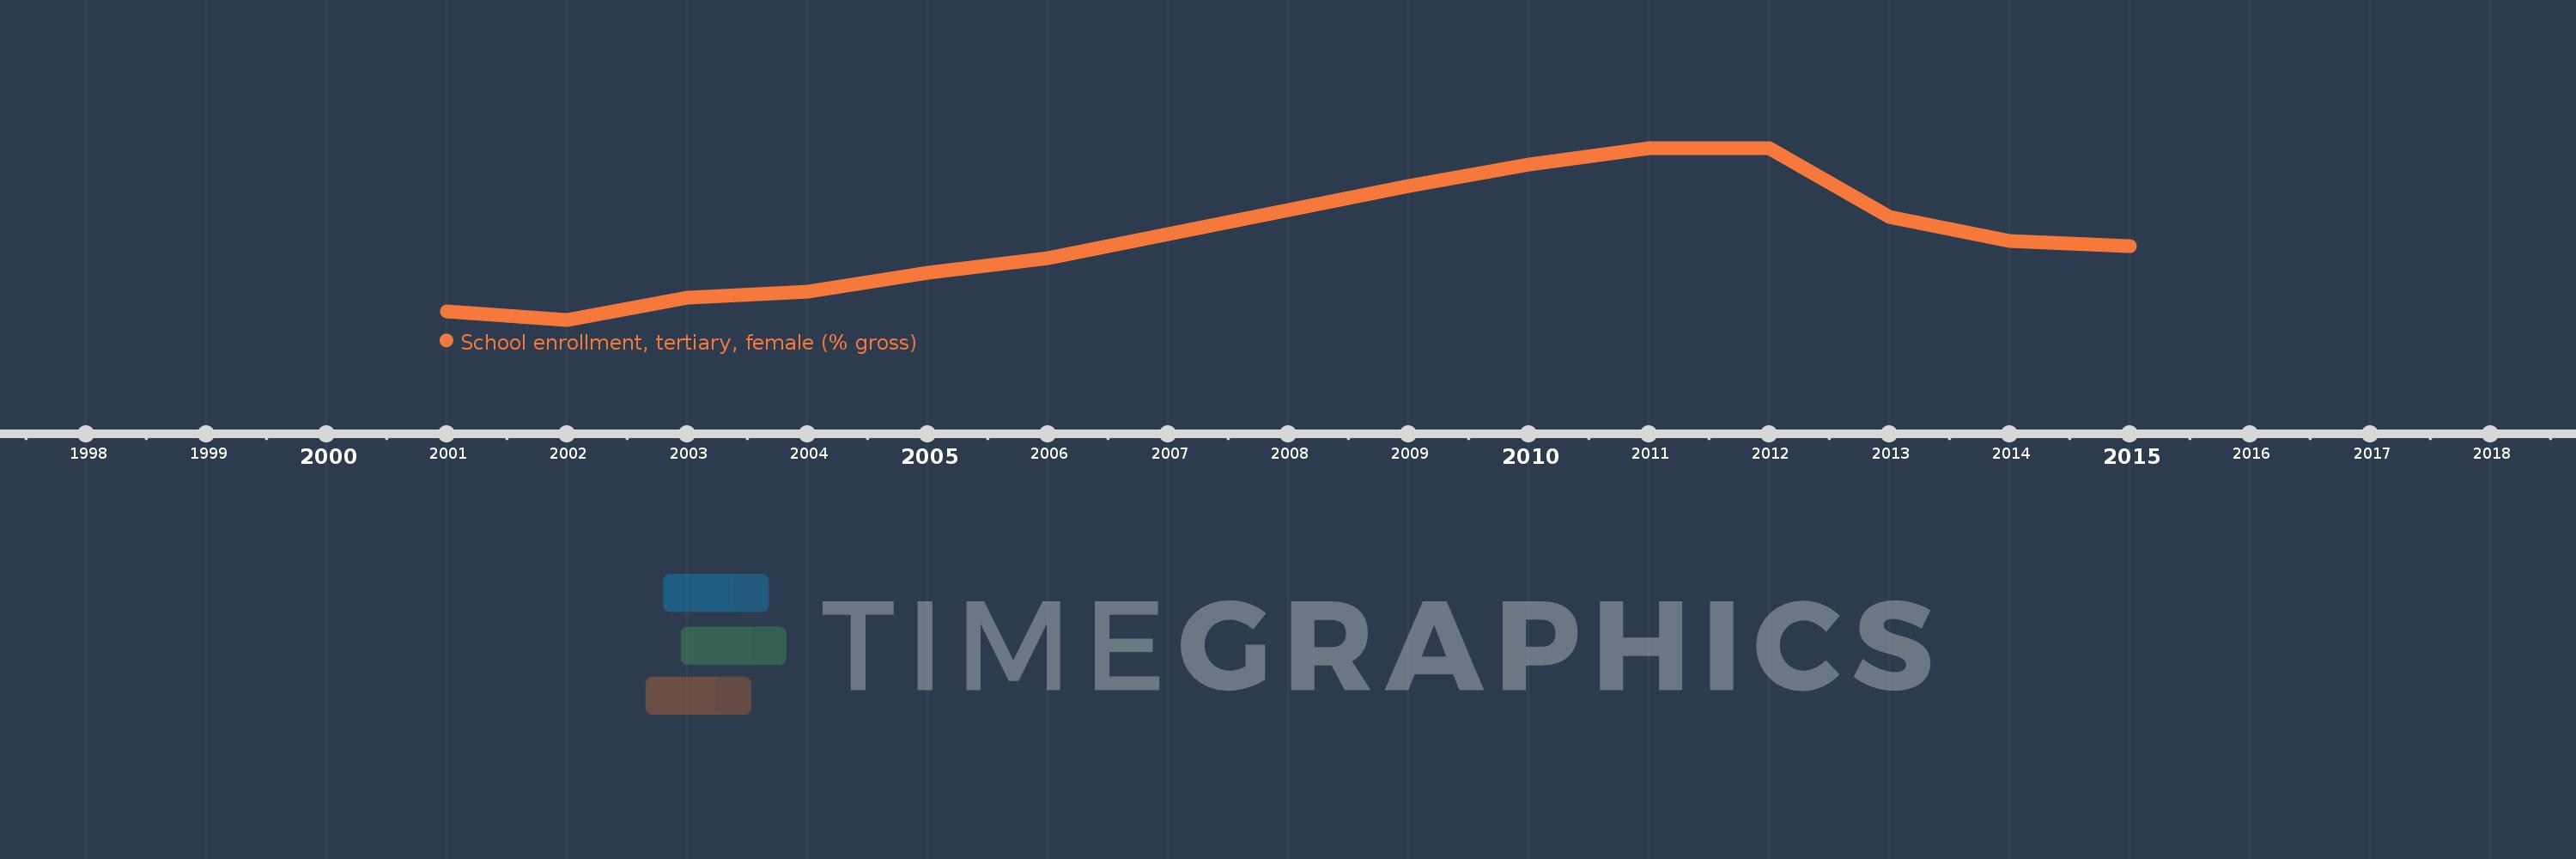
Questa scala temporale mostra un grafico dal 2001 anno al 2015 anno. Armenia. I dati fino ad 2000 anno non disponibili. Il numero di osservazioni attuali secondo i date: 15.
La fonte (nome):
Indicatori dello sviluppo mondiale
La fonte (organizzazione):
United Nations Educational, Scientific, and Cultural Organization (UNESCO) Institute for Statistics.
Categorie:
Education, Gender
sono stati aggiornati
23 apr 2017 anni
Indicatori delle variazioni dei valori per anni
In media:
49.932
Minima:
37.459
1 gen 2002 anni
Massimo:
63.195
1 gen 2012 anni
Alla data di osservazione
Valore
Variazione assoluta
La variazione rispetto al valore precedente
1 gen 2001 anni
38.679
+38.679
0.0%
1 gen 2002 anni
37.459
-1.22
-3.15%
1 gen 2003 anni
40.717
+3.259
8.7%
1 gen 2004 anni
41.701
+0.983
2.42%
1 gen 2005 anni
44.446
+2.745
6.58%
1 gen 2006 anni
46.659
+2.213
4.98%
1 gen 2007 anni
50.294
+3.635
7.79%
1 gen 2008 anni
53.841
+3.547
7.05%
1 gen 2009 anni
57.447
+3.606
6.7%
1 gen 2010 anni
60.738
+3.291
5.73%
1 gen 2011 anni
63.133
+2.395
3.94%
1 gen 2012 anni
63.195
+0.063
0.1%
1 gen 2013 anni
52.867
-10.328
-16.34%
1 gen 2014 anni
49.309
-3.557
-6.73%
1 gen 2015 anni
48.496
-0.814
-1.65%
Classificazione dei paesi secondo i statistiche attuali per anni