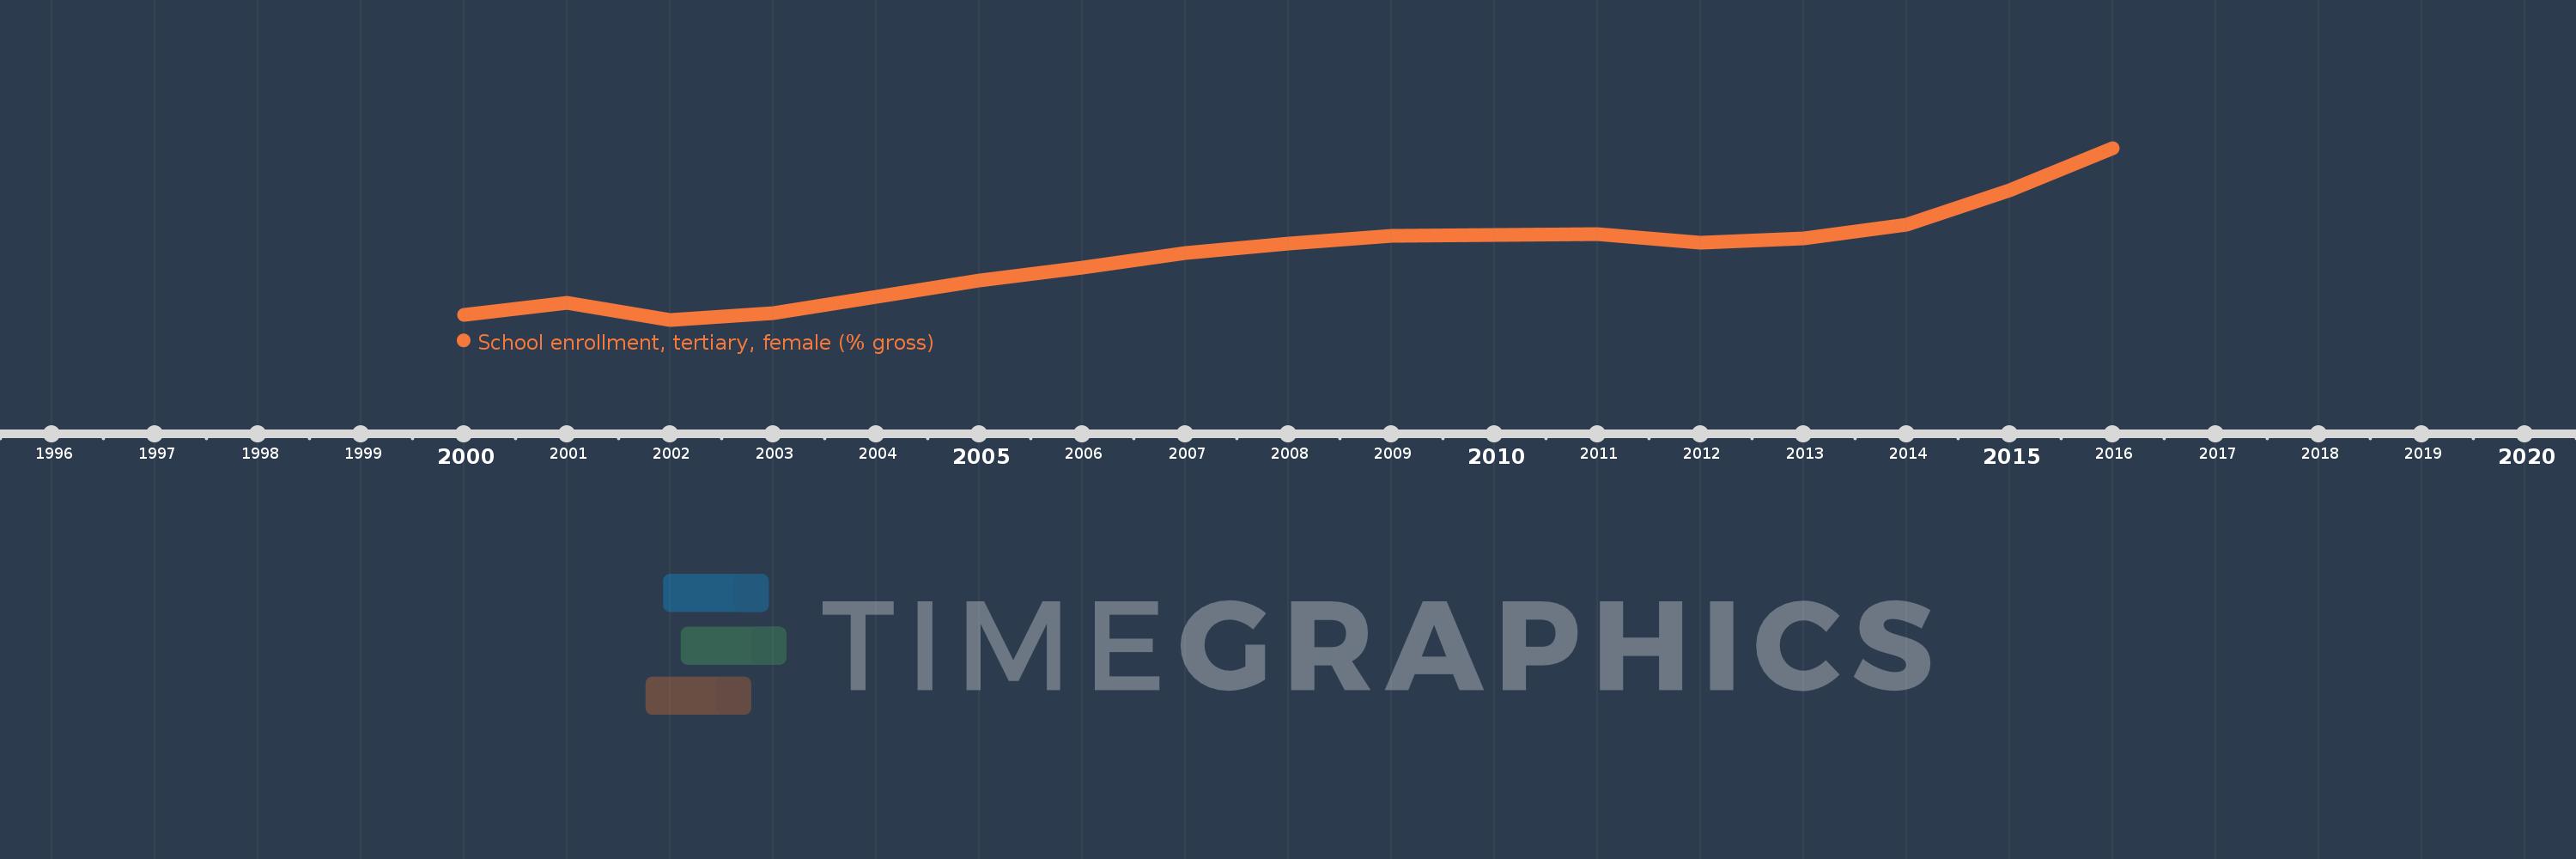
Questa scala temporale mostra un grafico dal 2000 anno al 2016 anno. Tajikistan. I dati fino ad 1999 anno non disponibili. Il numero di osservazioni attuali secondo i date: 17.
La fonte (nome):
Indicatori dello sviluppo mondiale
La fonte (organizzazione):
United Nations Educational, Scientific, and Cultural Organization (UNESCO) Institute for Statistics.
Categorie:
Education, Gender
sono stati aggiornati
23 apr 2017 anni
Indicatori delle variazioni dei valori per anni
In media:
14.297
Minima:
10.243
1 gen 2002 anni
Massimo:
21.081
1 gen 2016 anni
Alla data di osservazione
Valore
Variazione assoluta
La variazione rispetto al valore precedente
1 gen 2000 anni
10.535
+10.535
0.0%
1 gen 2001 anni
11.29
+0.755
7.16%
1 gen 2002 anni
10.243
-1.046
-9.27%
1 gen 2003 anni
10.662
+0.419
4.09%
1 gen 2004 anni
11.674
+1.012
9.49%
1 gen 2005 anni
12.7
+1.026
8.79%
1 gen 2006 anni
13.528
+0.829
6.53%
1 gen 2007 anni
14.45
+0.922
6.81%
1 gen 2008 anni
15.057
+0.607
4.2%
1 gen 2009 anni
15.519
+0.462
3.07%
1 gen 2010 anni
15.589
+0.07
0.45%
1 gen 2011 anni
15.643
+0.054
0.35%
1 gen 2012 anni
15.109
-0.534
-3.41%
1 gen 2013 anni
15.356
+0.247
1.63%
1 gen 2014 anni
16.216
+0.86
5.6%
1 gen 2015 anni
18.403
+2.187
13.49%
1 gen 2016 anni
21.081
+2.678
14.55%
Classificazione dei paesi secondo i statistiche attuali per anni