33
/it/
AIzaSyAYiBZKx7MnpbEhh9jyipgxe19OcubqV5w
August 1, 2025
81355
Belarus
BLR
true
2
1
Trained teachers in preprimary education, female (% of female teachers)
2015,2014,2013,2012,2011,2010,2009,2008,2007,2006,2005,2003
Download
Biblioteca di statistiche globali →Belarus →

Trained teachers in preprimary education, female (% of female teachers)

Queste statistiche in altri paesi:

AndorraAngolaAntigua and BarbudaArab WorldArmeniaArubaAzerbaijanBahamas, TheBahrainBarbadosBelarusBelizeBeninBermudaBhutanBoliviaBotswanaBritish Virgin IslandsBrunei DarussalamBurkina FasoBurundiCabo VerdeCambodiaCameroonCaribbean small statesCayman IslandsChadColombiaCongo, Dem. Rep.Congo, Rep.Costa RicaCote d'IvoireCroatiaCubaDjiboutiDominicaDominican RepublicEcuadorEgypt, Arab Rep.El SalvadorEritreaEthiopiaFragile and conflict affected situationsGambia, TheGeorgiaGhanaGibraltarGrenadaGuineaGuinea-BissauGuyanaHeavily indebted poor countries (HIPC)HondurasIDA blendIDA onlyIDA totalIraqKazakhstanKenyaKuwaitKyrgyz RepublicLao PDRLeast developed countries: UN classificationLebanonLiberiaLow incomeMacao SAR, ChinaMadagascarMalaysiaMaldivesMaliMarshall IslandsMauritaniaMauritiusMiddle East & North AfricaMiddle East & North Africa (excluding high income)Middle East & North Africa (IDA & IBRD countries)MoldovaMongoliaMoroccoMyanmarNamibiaNauruNepalNicaraguaNigerOmanOther small statesPacific island small statesPanamaParaguayPre-demographic dividendQatarRwandaSamoaSao Tome and PrincipeSaudi ArabiaSenegalSerbiaSeychellesSierra LeoneSmall statesSolomon IslandsSouth AfricaSouth SudanSt. Kitts and NevisSt. LuciaSt. Vincent and the GrenadinesSub-Saharan Africa Sub-Saharan Africa (excluding high income)Sub-Saharan Africa (IDA & IBRD countries)SurinameSwazilandSyrian Arab RepublicTajikistanTanzaniaTogoTongaTrinidad and TobagoTuvaluUnited Arab EmiratesUzbekistanVietnamWest Bank and GazaZimbabwe

Linea del tempo:

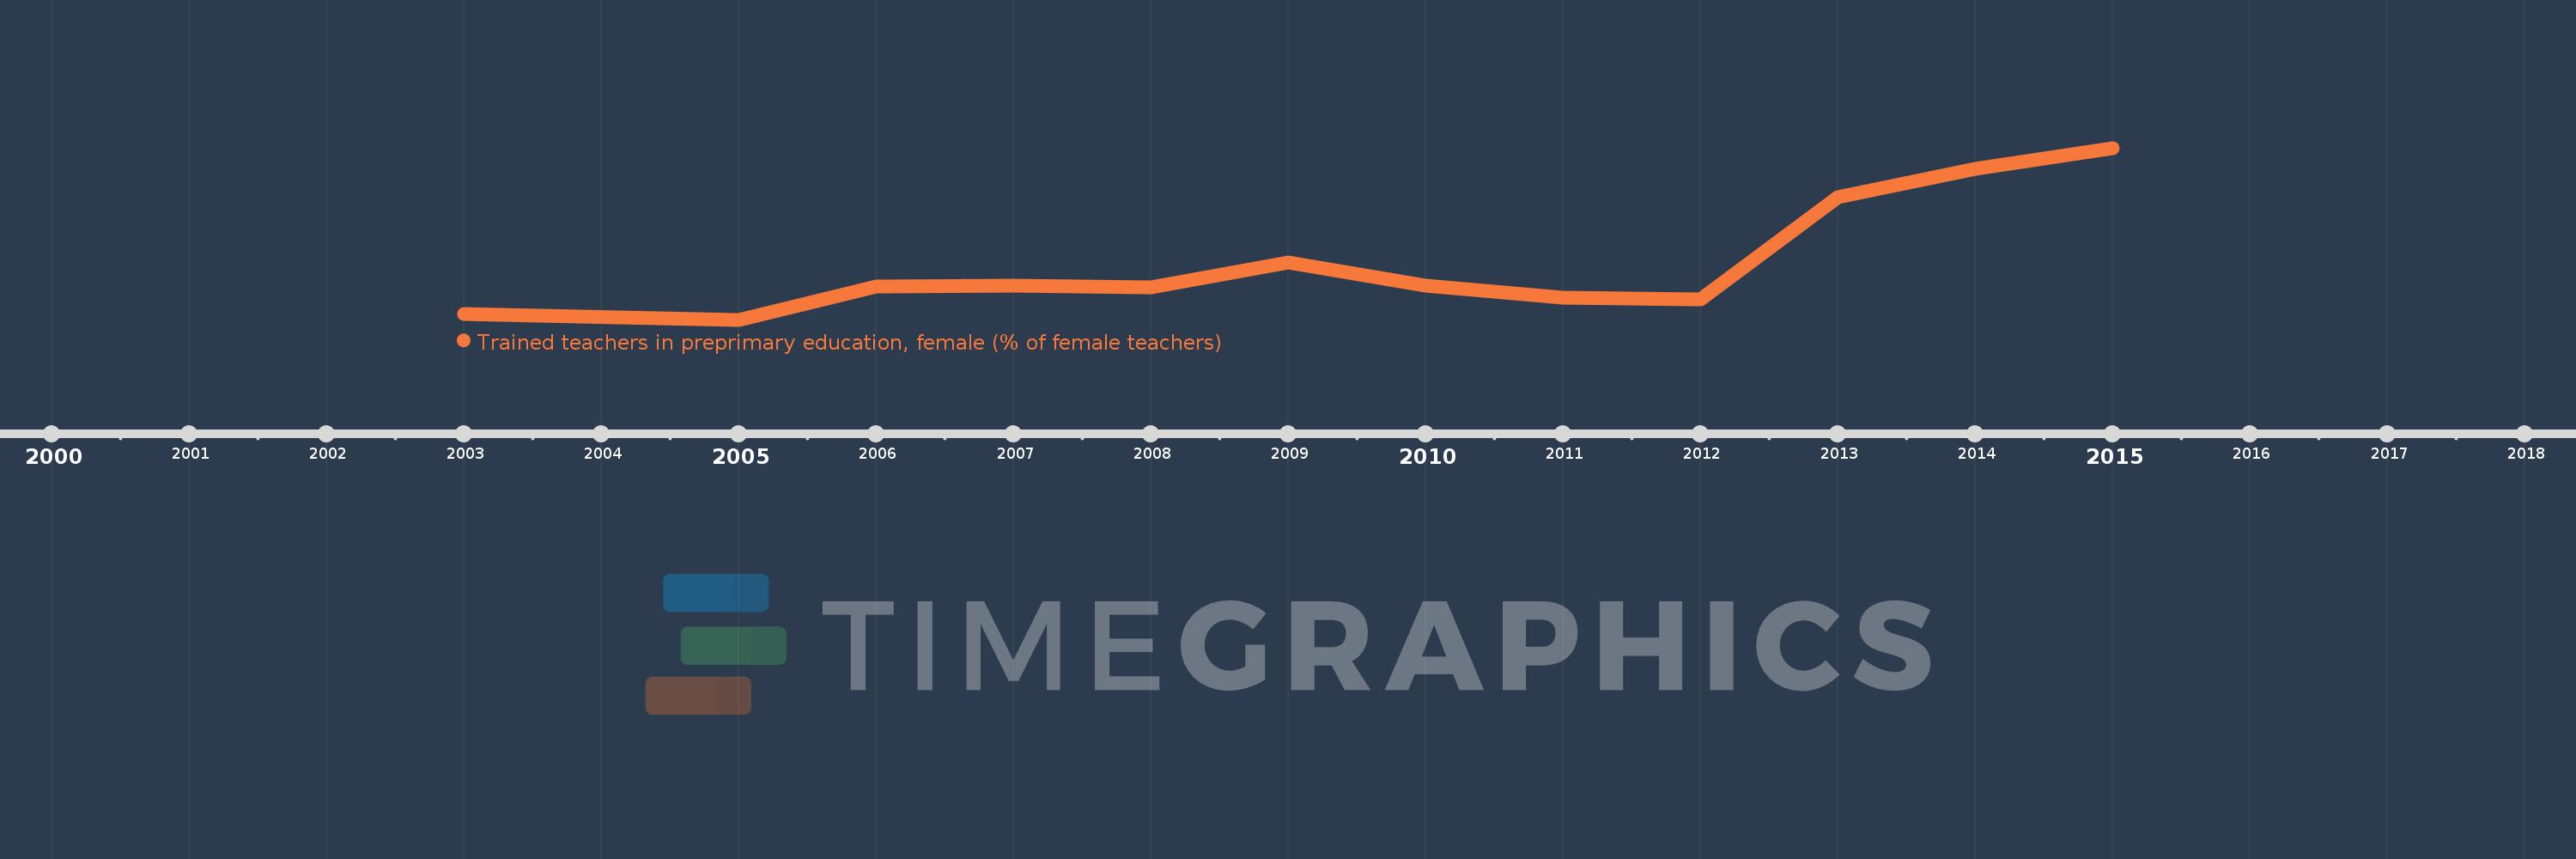
Questa scala temporale mostra un grafico dal 2003 anno al 2015 anno. Belarus. I dati fino ad 2002 anno non disponibili. Il numero di osservazioni attuali secondo i date: 12.

La fonte (nome):

Indicatori dello sviluppo mondiale

La fonte (organizzazione):

United Nations Educational, Scientific, and Cultural Organization (UNESCO) Institute for Statistics.

Categorie:

Education

sono stati aggiornati

23 apr 2017 anni

Indicatori delle variazioni dei valori per anni

In media:
69.145
Minima:
57.68
1 gen 2005 anni
Massimo:
92.2
1 gen 2015 anni
Alla data di osservazione
Valore
Variazione assoluta
La variazione rispetto al valore precedente
1 gen 2003 anni
58.786
+58.786
0.0%
1 gen 2005 anni
57.68
-1.106
-1.88%
1 gen 2006 anni
64.377
+6.697
11.61%
1 gen 2007 anni
64.536
+0.158
0.25%
1 gen 2008 anni
64.241
-0.295
-0.46%
1 gen 2009 anni
69.189
+4.949
7.7%
1 gen 2010 anni
64.545
-4.644
-6.71%
1 gen 2011 anni
62.173
-2.372
-3.67%
1 gen 2012 anni
61.703
-0.47
-0.76%
1 gen 2013 anni
82.305
+20.602
33.39%
1 gen 2014 anni
88.01
+5.705
6.93%
1 gen 2015 anni
92.2
+4.19
4.76%

Classificazione dei paesi secondo i statistiche attuali per anni