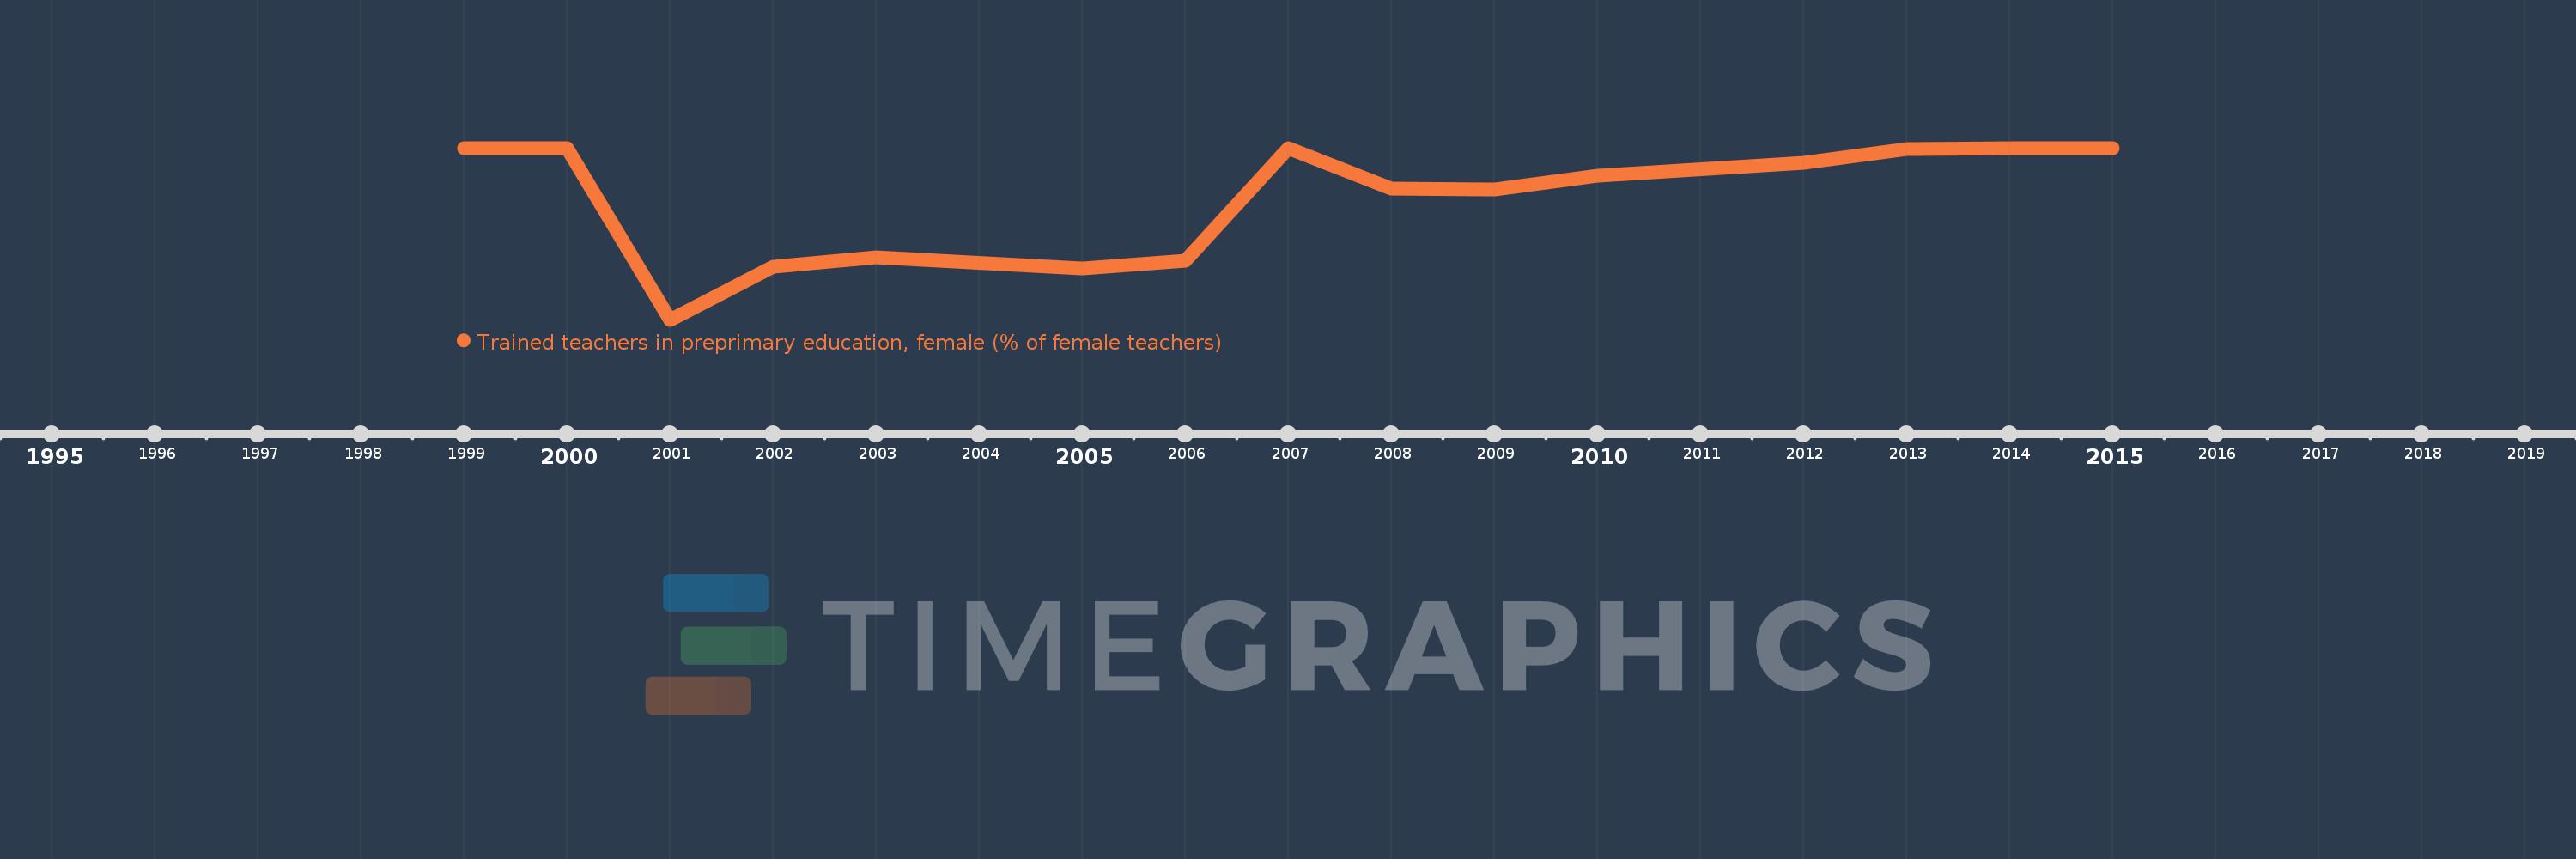
Questa scala temporale mostra un grafico dal 1999 anno al 2015 anno. Mauritius. I dati fino ad 1998 anno non disponibili. Il numero di osservazioni attuali secondo i date: 15.
La fonte (nome):
Indicatori dello sviluppo mondiale
La fonte (organizzazione):
United Nations Educational, Scientific, and Cultural Organization (UNESCO) Institute for Statistics.
Categorie:
Education
sono stati aggiornati
23 apr 2017 anni
Indicatori delle variazioni dei valori per anni
In media:
95.649
Minima:
85.253
1 gen 2001 anni
Massimo:
100.0
1 gen 1999 anni
Alla data di osservazione
Valore
Variazione assoluta
La variazione rispetto al valore precedente
1 gen 1999 anni
100.0
+100.0
0.0%
1 gen 2000 anni
100.0
0.0
0.0%
1 gen 2001 anni
85.253
-14.747
-14.75%
1 gen 2002 anni
89.799
+4.546
5.33%
1 gen 2003 anni
90.582
+0.783
0.87%
1 gen 2005 anni
89.652
-0.93
-1.03%
1 gen 2006 anni
90.284
+0.632
0.7%
1 gen 2007 anni
100.0
+9.716
10.76%
1 gen 2008 anni
96.498
-3.502
-3.5%
1 gen 2009 anni
96.44
-0.058
-0.06%
1 gen 2010 anni
97.604
+1.164
1.21%
1 gen 2012 anni
98.739
+1.135
1.16%
1 gen 2013 anni
99.921
+1.182
1.2%
1 gen 2014 anni
99.959
+0.038
0.04%
1 gen 2015 anni
100.0
+0.041
0.04%
Classificazione dei paesi secondo i statistiche attuali per anni