33
/it/
AIzaSyAYiBZKx7MnpbEhh9jyipgxe19OcubqV5w
August 1, 2025
212470
Niger
NER
true
2
1
Trained teachers in preprimary education, female (% of female teachers)
2013,2012,2011,2010,2009,2008,2005,2004,2003,2002,2001,2000
Download
Biblioteca di statistiche globali →Niger →

Trained teachers in preprimary education, female (% of female teachers)

Queste statistiche in altri paesi:

AndorraAngolaAntigua and BarbudaArab WorldArmeniaArubaAzerbaijanBahamas, TheBahrainBarbadosBelarusBelizeBeninBermudaBhutanBoliviaBotswanaBritish Virgin IslandsBrunei DarussalamBurkina FasoBurundiCabo VerdeCambodiaCameroonCaribbean small statesCayman IslandsChadColombiaCongo, Dem. Rep.Congo, Rep.Costa RicaCote d'IvoireCroatiaCubaDjiboutiDominicaDominican RepublicEcuadorEgypt, Arab Rep.El SalvadorEritreaEthiopiaFragile and conflict affected situationsGambia, TheGeorgiaGhanaGibraltarGrenadaGuineaGuinea-BissauGuyanaHeavily indebted poor countries (HIPC)HondurasIDA blendIDA onlyIDA totalIraqKazakhstanKenyaKuwaitKyrgyz RepublicLao PDRLeast developed countries: UN classificationLebanonLiberiaLow incomeMacao SAR, ChinaMadagascarMalaysiaMaldivesMaliMarshall IslandsMauritaniaMauritiusMiddle East & North AfricaMiddle East & North Africa (excluding high income)Middle East & North Africa (IDA & IBRD countries)MoldovaMongoliaMoroccoMyanmarNamibiaNauruNepalNicaraguaNigerOmanOther small statesPacific island small statesPanamaParaguayPre-demographic dividendQatarRwandaSamoaSao Tome and PrincipeSaudi ArabiaSenegalSerbiaSeychellesSierra LeoneSmall statesSolomon IslandsSouth AfricaSouth SudanSt. Kitts and NevisSt. LuciaSt. Vincent and the GrenadinesSub-Saharan Africa Sub-Saharan Africa (excluding high income)Sub-Saharan Africa (IDA & IBRD countries)SurinameSwazilandSyrian Arab RepublicTajikistanTanzaniaTogoTongaTrinidad and TobagoTuvaluUnited Arab EmiratesUzbekistanVietnamWest Bank and GazaZimbabwe

Linea del tempo:

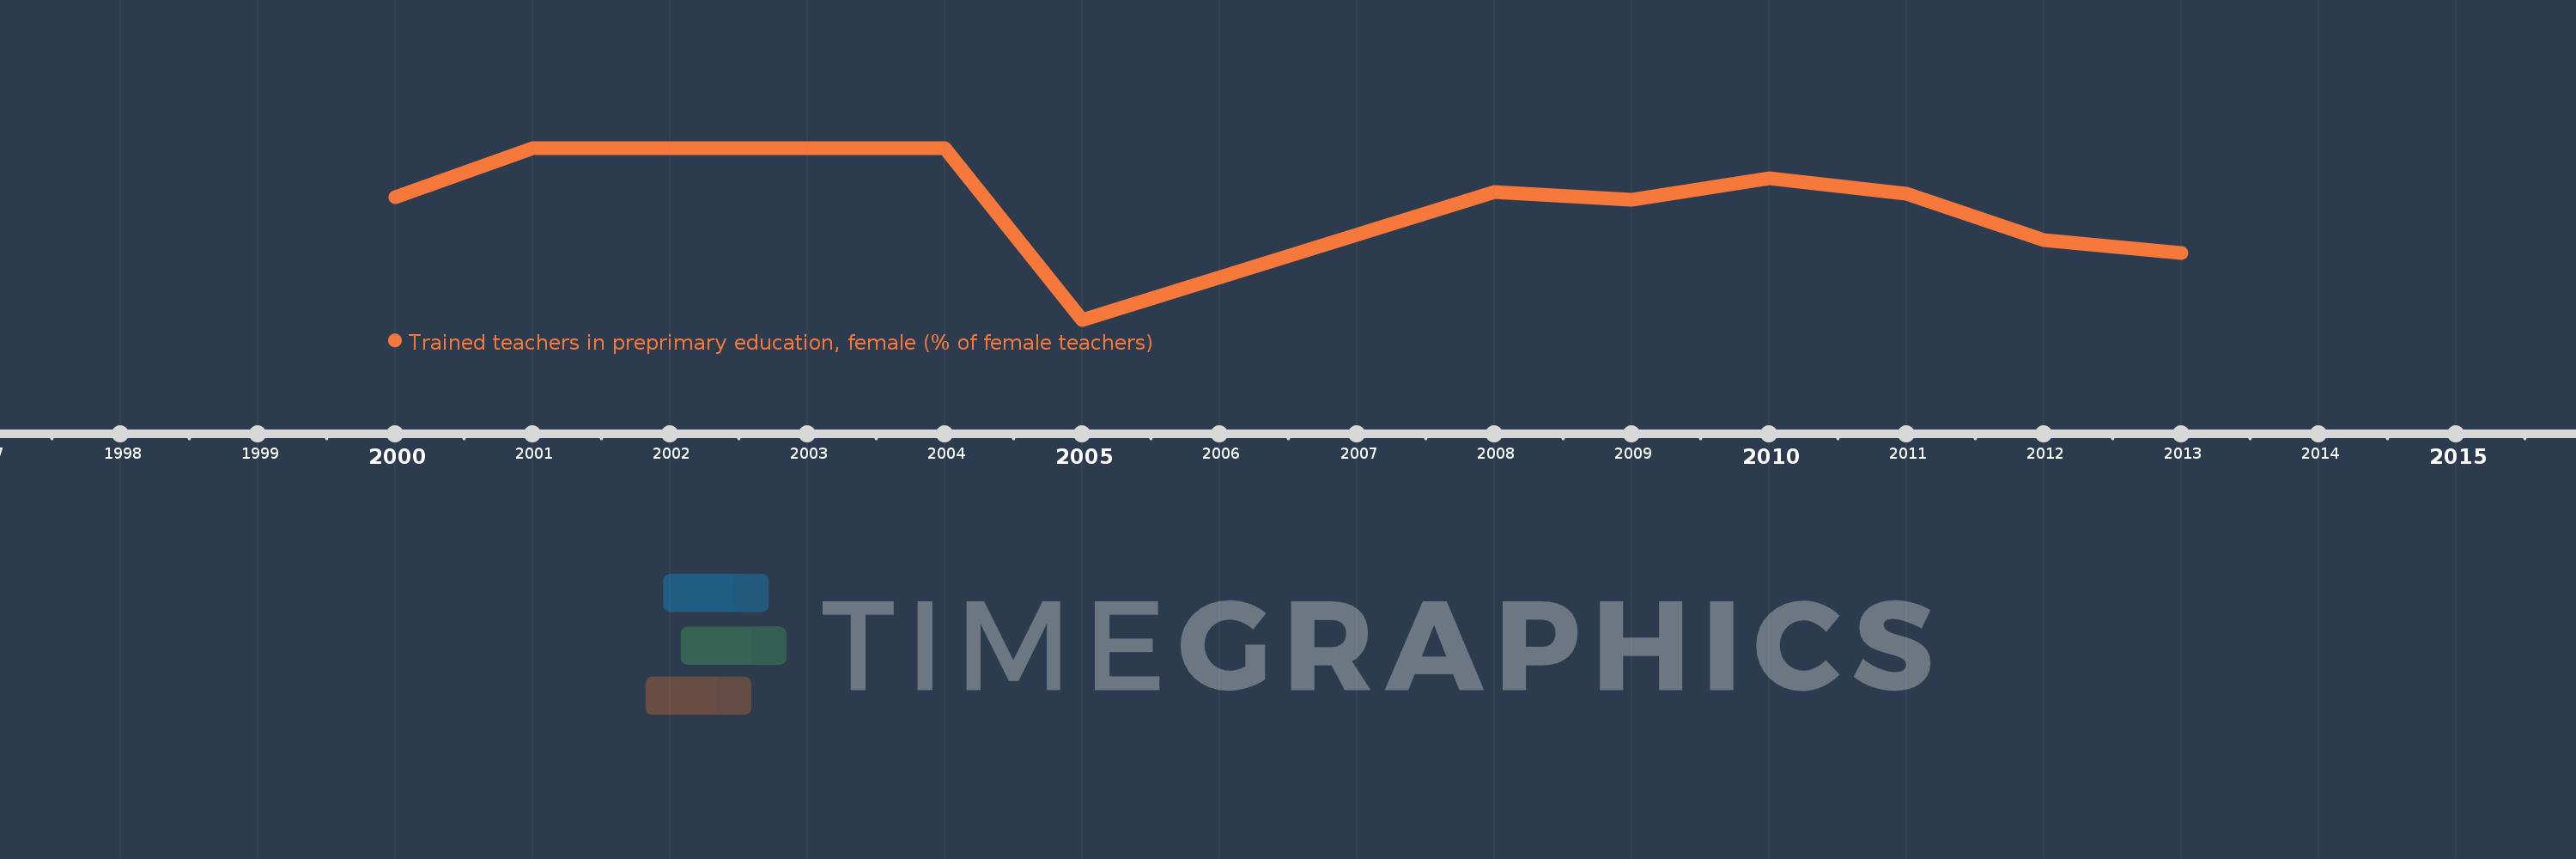
Questa scala temporale mostra un grafico dal 2000 anno al 2013 anno. Niger. I dati fino ad 1999 anno non disponibili. Il numero di osservazioni attuali secondo i date: 12.

La fonte (nome):

Indicatori dello sviluppo mondiale

La fonte (organizzazione):

United Nations Educational, Scientific, and Cultural Organization (UNESCO) Institute for Statistics.

Categorie:

Education

sono stati aggiornati

23 apr 2017 anni

Indicatori delle variazioni dei valori per anni

In media:
95.941
Minima:
85.849
1 gen 2005 anni
Massimo:
100.0
1 gen 2001 anni
Alla data di osservazione
Valore
Variazione assoluta
La variazione rispetto al valore precedente
1 gen 2000 anni
95.963
+95.963
0.0%
1 gen 2001 anni
100.0
+4.037
4.21%
1 gen 2002 anni
100.0
0.0
0.0%
1 gen 2003 anni
100.0
0.0
0.0%
1 gen 2004 anni
100.0
0.0
0.0%
1 gen 2005 anni
85.849
-14.151
-14.15%
1 gen 2008 anni
96.341
+10.492
12.22%
1 gen 2009 anni
95.721
-0.62
-0.64%
1 gen 2010 anni
97.485
+1.763
1.84%
1 gen 2011 anni
96.238
-1.247
-1.28%
1 gen 2012 anni
92.376
-3.861
-4.01%
1 gen 2013 anni
91.314
-1.062
-1.15%

Classificazione dei paesi secondo i statistiche attuali per anni