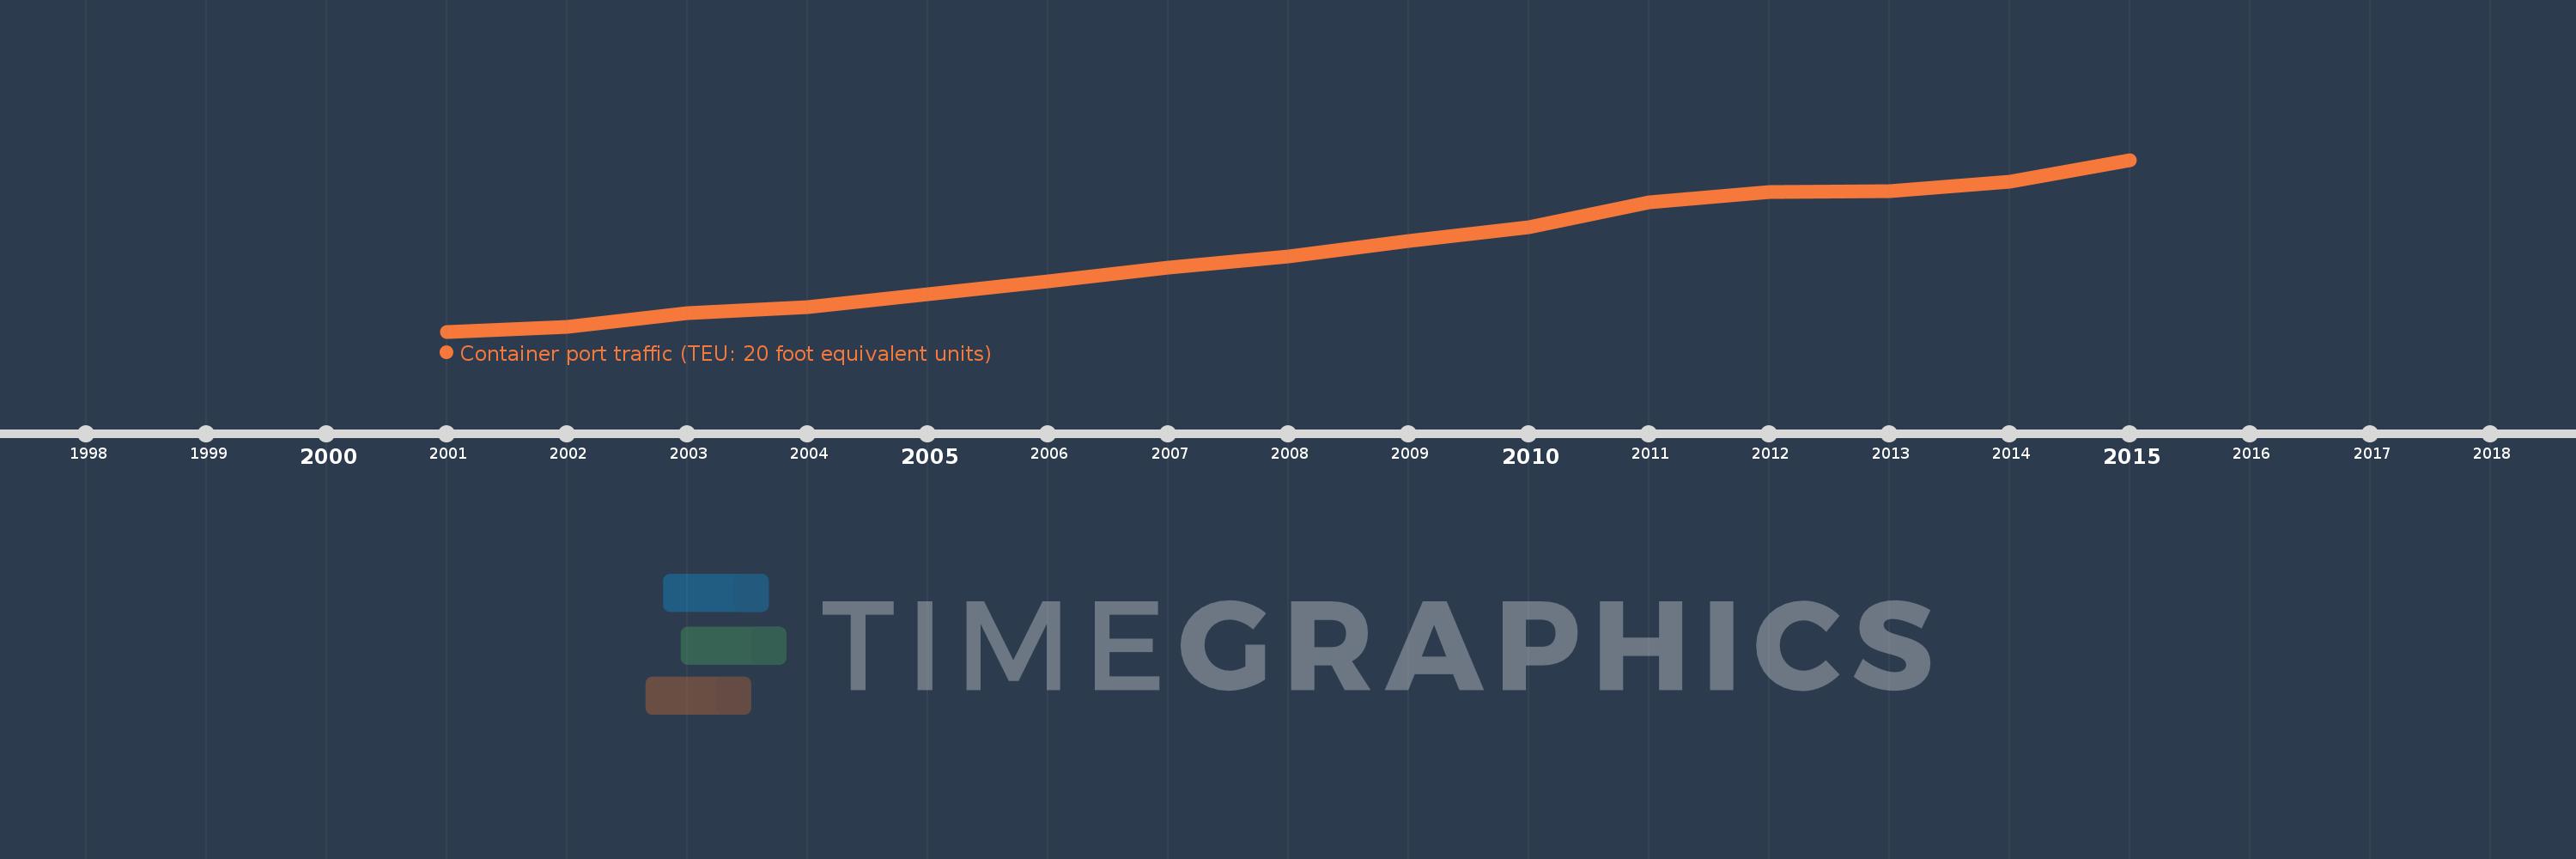
Questa scala temporale mostra un grafico dal 2001 anno al 2015 anno. Bangladesh. I dati fino ad 2000 anno non disponibili. Il numero di osservazioni attuali secondo i date: 15.
La fonte (nome):
Indicatori dello sviluppo mondiale
La fonte (organizzazione):
Containerisation International, Containerisation International Yearbook.
Categorie:
Infrastructure
sono stati aggiornati
23 apr 2017 anni
Indicatori delle variazioni dei valori per anni
In media:
1.014 Mln
Minima:
456.007 Mille.
1 gen 2001 anni
Massimo:
1.655 Mln
1 gen 2015 anni
Alla data di osservazione
Valore
Variazione assoluta
La variazione rispetto al valore precedente
1 gen 2001 anni
456.007 Mille.
+456.007 Mille.
0.0%
1 gen 2002 anni
486.289 Mille.
+30.282 Mille.
6.64%
1 gen 2003 anni
584.22 Mille.
+97.931 Mille.
20.14%
1 gen 2004 anni
625.16 Mille.
+40.94 Mille.
7.01%
1 gen 2005 anni
714.42 Mille.
+89.26 Mille.
14.28%
1 gen 2006 anni
808.924 Mille.
+94.504 Mille.
13.23%
1 gen 2007 anni
901.528 Mille.
+92.604 Mille.
11.45%
1 gen 2008 anni
978.007 Mille.
+76.479 Mille.
8.48%
1 gen 2009 anni
1.091 Mln
+113.193 Mille.
11.57%
1 gen 2010 anni
1.182 Mln
+90.921 Mille.
8.33%
1 gen 2011 anni
1.356 Mln
+173.978 Mille.
14.72%
1 gen 2012 anni
1.432 Mln
+75.752 Mille.
5.59%
1 gen 2013 anni
1.436 Mln
+3.749 Mille.
0.26%
1 gen 2014 anni
1.5 Mln
+64.561 Mille.
4.5%
1 gen 2015 anni
1.655 Mln
+155.204 Mille.
10.35%
Classificazione dei paesi secondo i statistiche attuali per anni