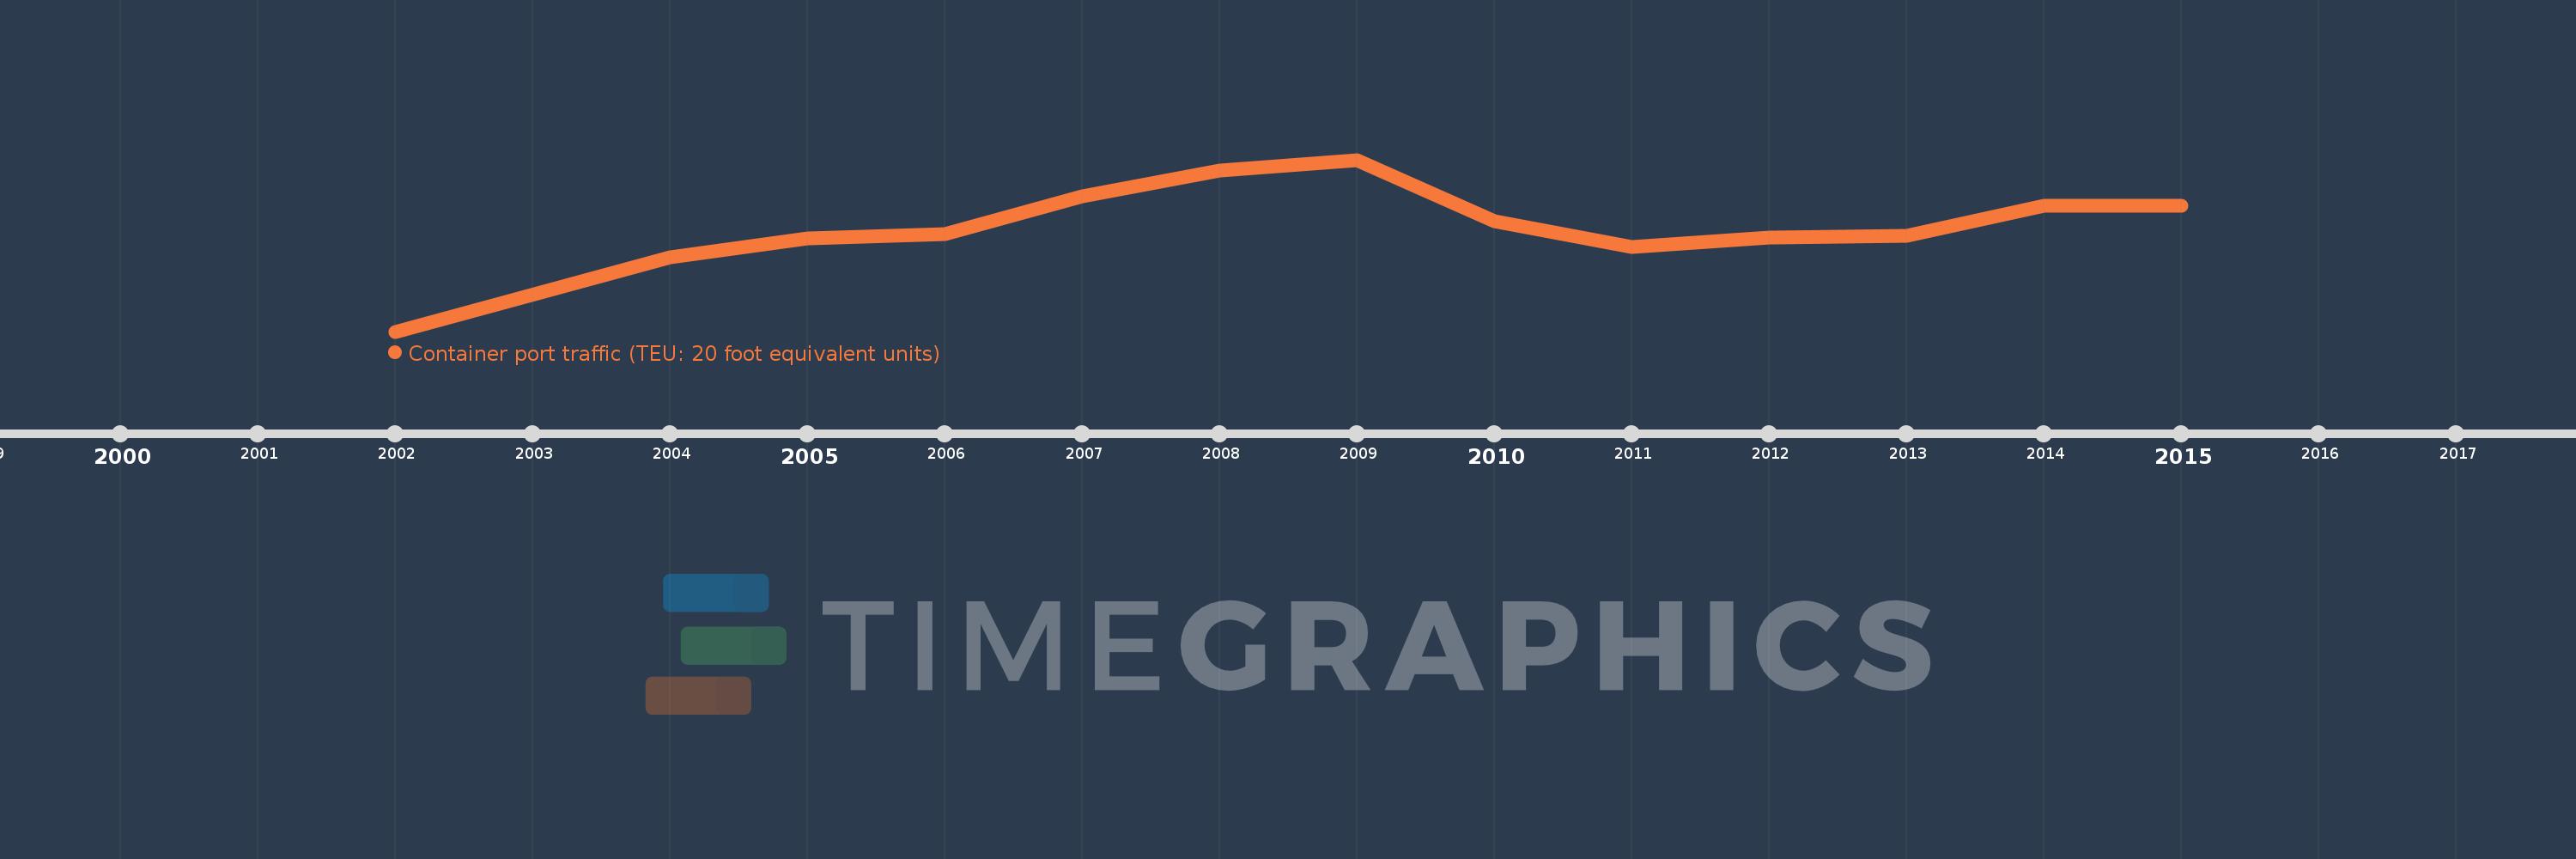
Questa scala temporale mostra un grafico dal 2002 anno al 2015 anno. Bahamas, The. I dati fino ad 2001 anno non disponibili. Il numero di osservazioni attuali secondo i date: 13.
La fonte (nome):
Indicatori dello sviluppo mondiale
La fonte (organizzazione):
Containerisation International, Containerisation International Yearbook.
Categorie:
Infrastructure
sono stati aggiornati
23 apr 2017 anni
Indicatori delle variazioni dei valori per anni
In media:
1.264 Mln
Minima:
570.0 Mille.
1 gen 2002 anni
Massimo:
1.702 Mln
1 gen 2009 anni
Alla data di osservazione
Valore
Variazione assoluta
La variazione rispetto al valore precedente
1 gen 2002 anni
570.0 Mille.
+570.0 Mille.
0.0%
1 gen 2004 anni
1.058 Mln
+487.879 Mille.
85.59%
1 gen 2005 anni
1.185 Mln
+126.921 Mille.
12.0%
1 gen 2006 anni
1.212 Mln
+26.7 Mille.
2.25%
1 gen 2007 anni
1.463 Mln
+251.5 Mille.
20.76%
1 gen 2008 anni
1.632 Mln
+169.0 Mille.
11.55%
1 gen 2009 anni
1.702 Mln
+70.0 Mille.
4.29%
1 gen 2010 anni
1.297 Mln
-405.0 Mille.
-23.8%
1 gen 2011 anni
1.125 Mln
-172.0 Mille.
-13.26%
1 gen 2012 anni
1.189 Mln
+64.125 Mille.
5.7%
1 gen 2013 anni
1.202 Mln
+12.875 Mille.
1.08%
1 gen 2014 anni
1.4 Mln
+198.0 Mille.
16.47%
1 gen 2015 anni
1.399 Mln
-700.0
-0.05%
Classificazione dei paesi secondo i statistiche attuali per anni