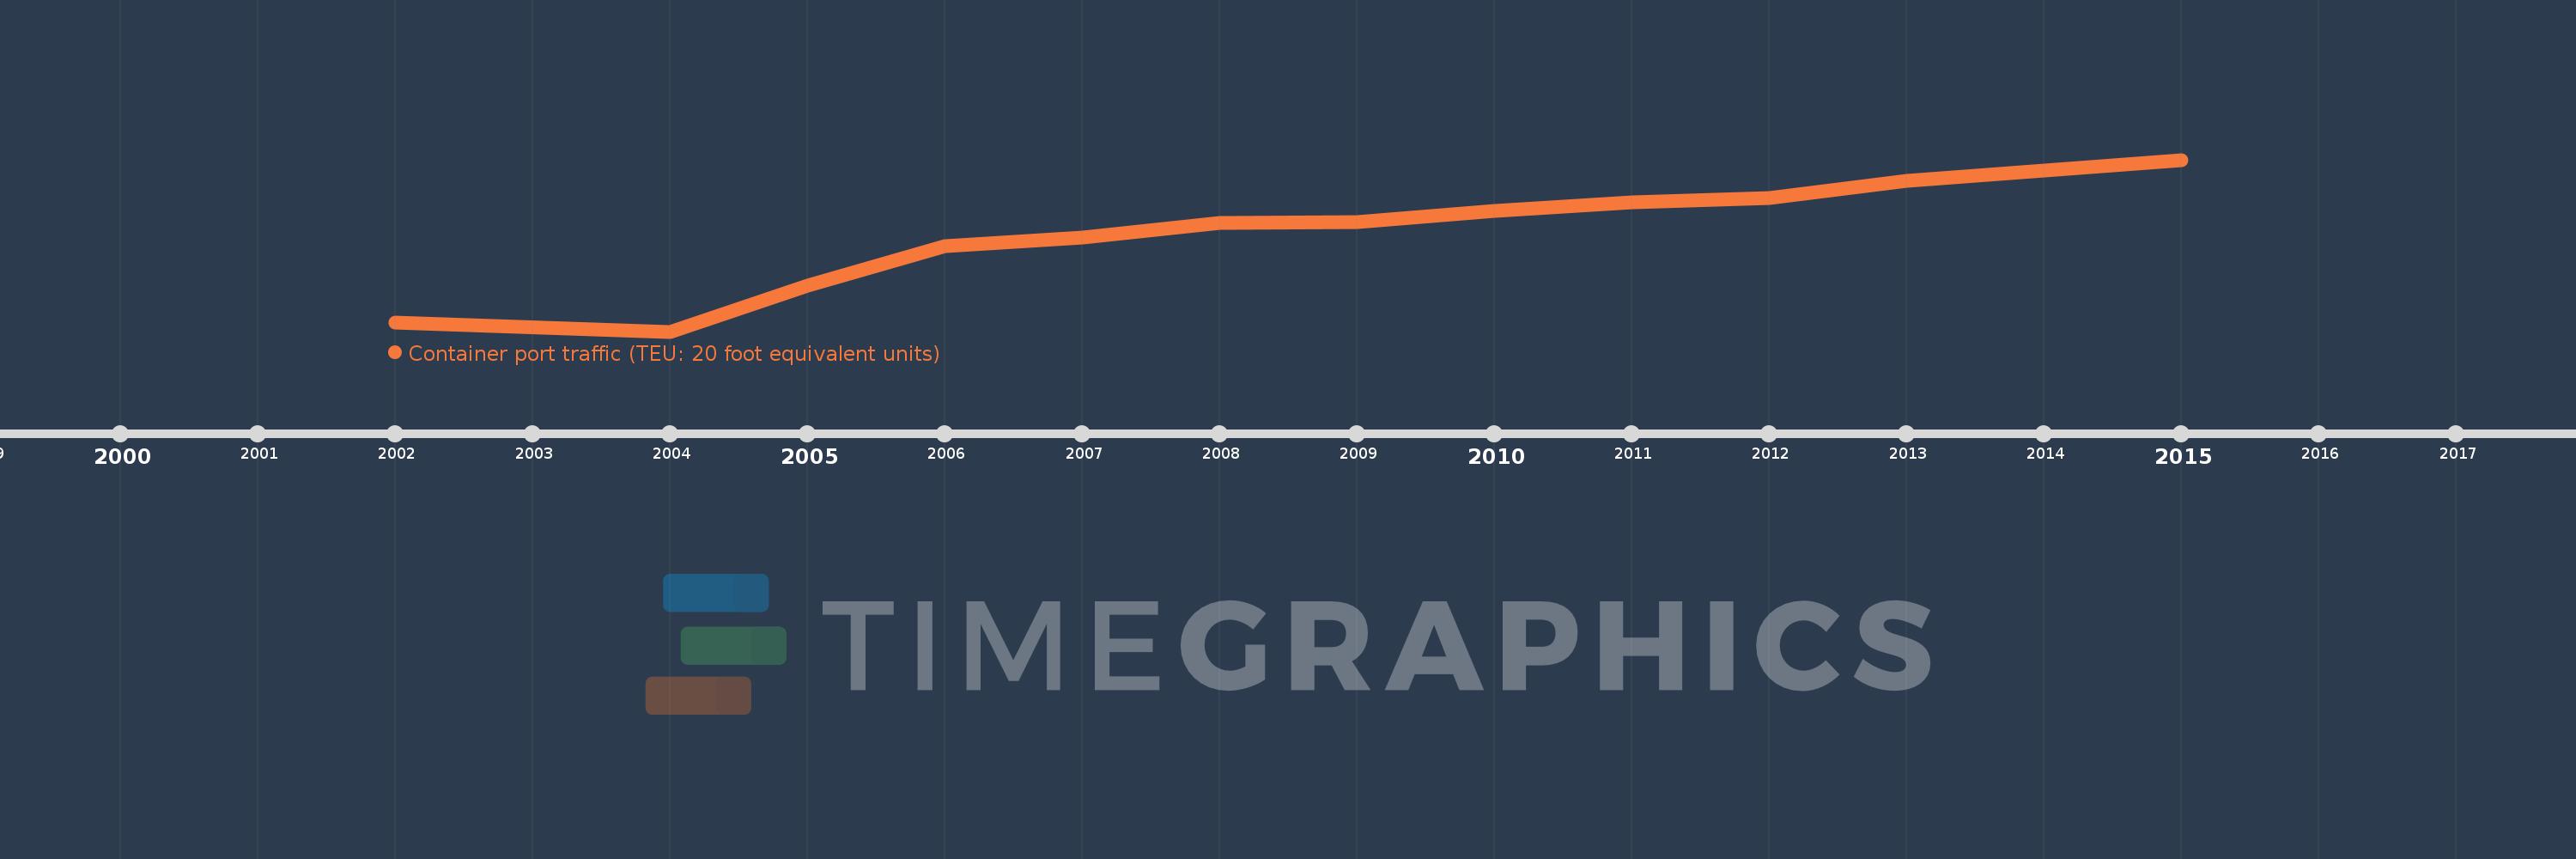
Questa scala temporale mostra un grafico dal 2002 anno al 2015 anno. Pakistan. I dati fino ad 2001 anno non disponibili. Il numero di osservazioni attuali secondo i date: 13.
La fonte (nome):
Indicatori dello sviluppo mondiale
La fonte (organizzazione):
Containerisation International, Containerisation International Yearbook.
Categorie:
Infrastructure
sono stati aggiornati
23 apr 2017 anni
Indicatori delle variazioni dei valori per anni
In media:
1.856 Mln
Minima:
787.559 Mille.
1 gen 2004 anni
Massimo:
2.597 Mln
1 gen 2015 anni
Alla data di osservazione
Valore
Variazione assoluta
La variazione rispetto al valore precedente
1 gen 2002 anni
878.892 Mille.
+878.892 Mille.
0.0%
1 gen 2004 anni
787.559 Mille.
-91.333 Mille.
-10.39%
1 gen 2005 anni
1.269 Mln
+481.814 Mille.
61.18%
1 gen 2006 anni
1.686 Mln
+416.982 Mille.
32.85%
1 gen 2007 anni
1.777 Mln
+90.584 Mille.
5.37%
1 gen 2008 anni
1.936 Mln
+158.943 Mille.
8.94%
1 gen 2009 anni
1.938 Mln
+2.119 Mille.
0.11%
1 gen 2010 anni
2.058 Mln
+120.055 Mille.
6.19%
1 gen 2011 anni
2.149 Mln
+90.944 Mille.
4.42%
1 gen 2012 anni
2.193 Mln
+44.403 Mille.
2.07%
1 gen 2013 anni
2.375 Mln
+181.755 Mille.
8.29%
1 gen 2014 anni
2.485 Mln
+109.927 Mille.
4.63%
1 gen 2015 anni
2.597 Mln
+112.309 Mille.
4.52%
Classificazione dei paesi secondo i statistiche attuali per anni