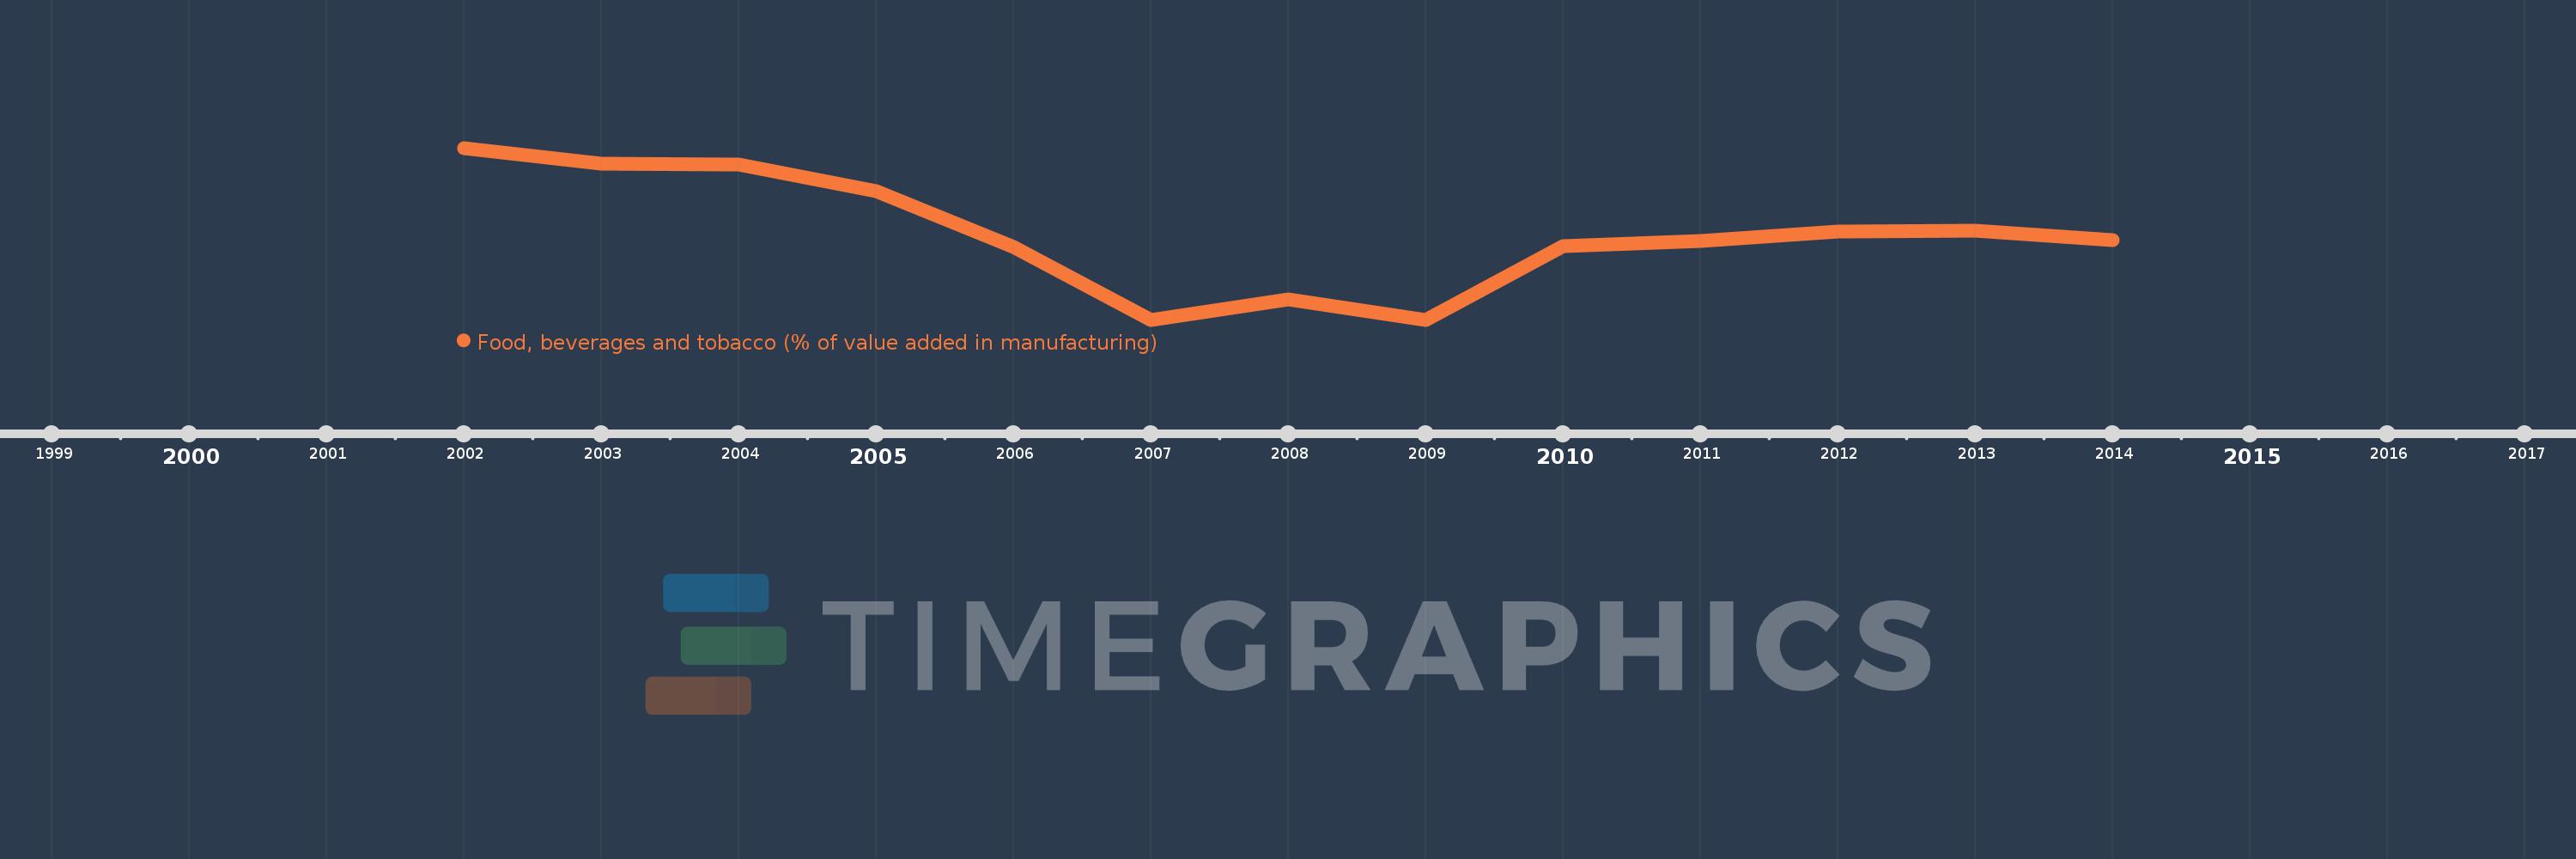
Questa scala temporale mostra un grafico dal 2002 anno al 2014 anno. Azerbaijan. I dati fino ad 2001 anno non disponibili. Il numero di osservazioni attuali secondo i date: 13.
La fonte (nome):
Indicatori dello sviluppo mondiale
La fonte (organizzazione):
United Nations Industrial Development Organization, International Yearbook of Industrial Statistics.
Categorie:
Economy & Growth
sono stati aggiornati
23 apr 2017 anni
Indicatori delle variazioni dei valori per anni
In media:
28.376
Minima:
14.803
1 gen 2007 anni
Massimo:
42.002
1 gen 2002 anni
Alla data di osservazione
Valore
Variazione assoluta
La variazione rispetto al valore precedente
1 gen 2002 anni
42.002
+42.002
0.0%
1 gen 2003 anni
39.561
-2.44
-5.81%
1 gen 2004 anni
39.316
-0.245
-0.62%
1 gen 2005 anni
35.147
-4.17
-10.61%
1 gen 2006 anni
26.38
-8.767
-24.94%
1 gen 2007 anni
14.803
-11.576
-43.88%
1 gen 2008 anni
18.068
+3.265
22.06%
1 gen 2009 anni
14.81
-3.259
-18.04%
1 gen 2010 anni
26.433
+11.623
78.48%
1 gen 2011 anni
27.254
+0.821
3.1%
1 gen 2012 anni
28.721
+1.468
5.39%
1 gen 2013 anni
28.918
+0.197
0.69%
1 gen 2014 anni
27.474
-1.445
-5.0%
Classificazione dei paesi secondo i statistiche attuali per anni