33
/it/
AIzaSyB4mHJ5NPEv-XzF7P6NDYXjlkCWaeKw5bc
November 30, 2025
262223
Thailand
THA
true
2
1
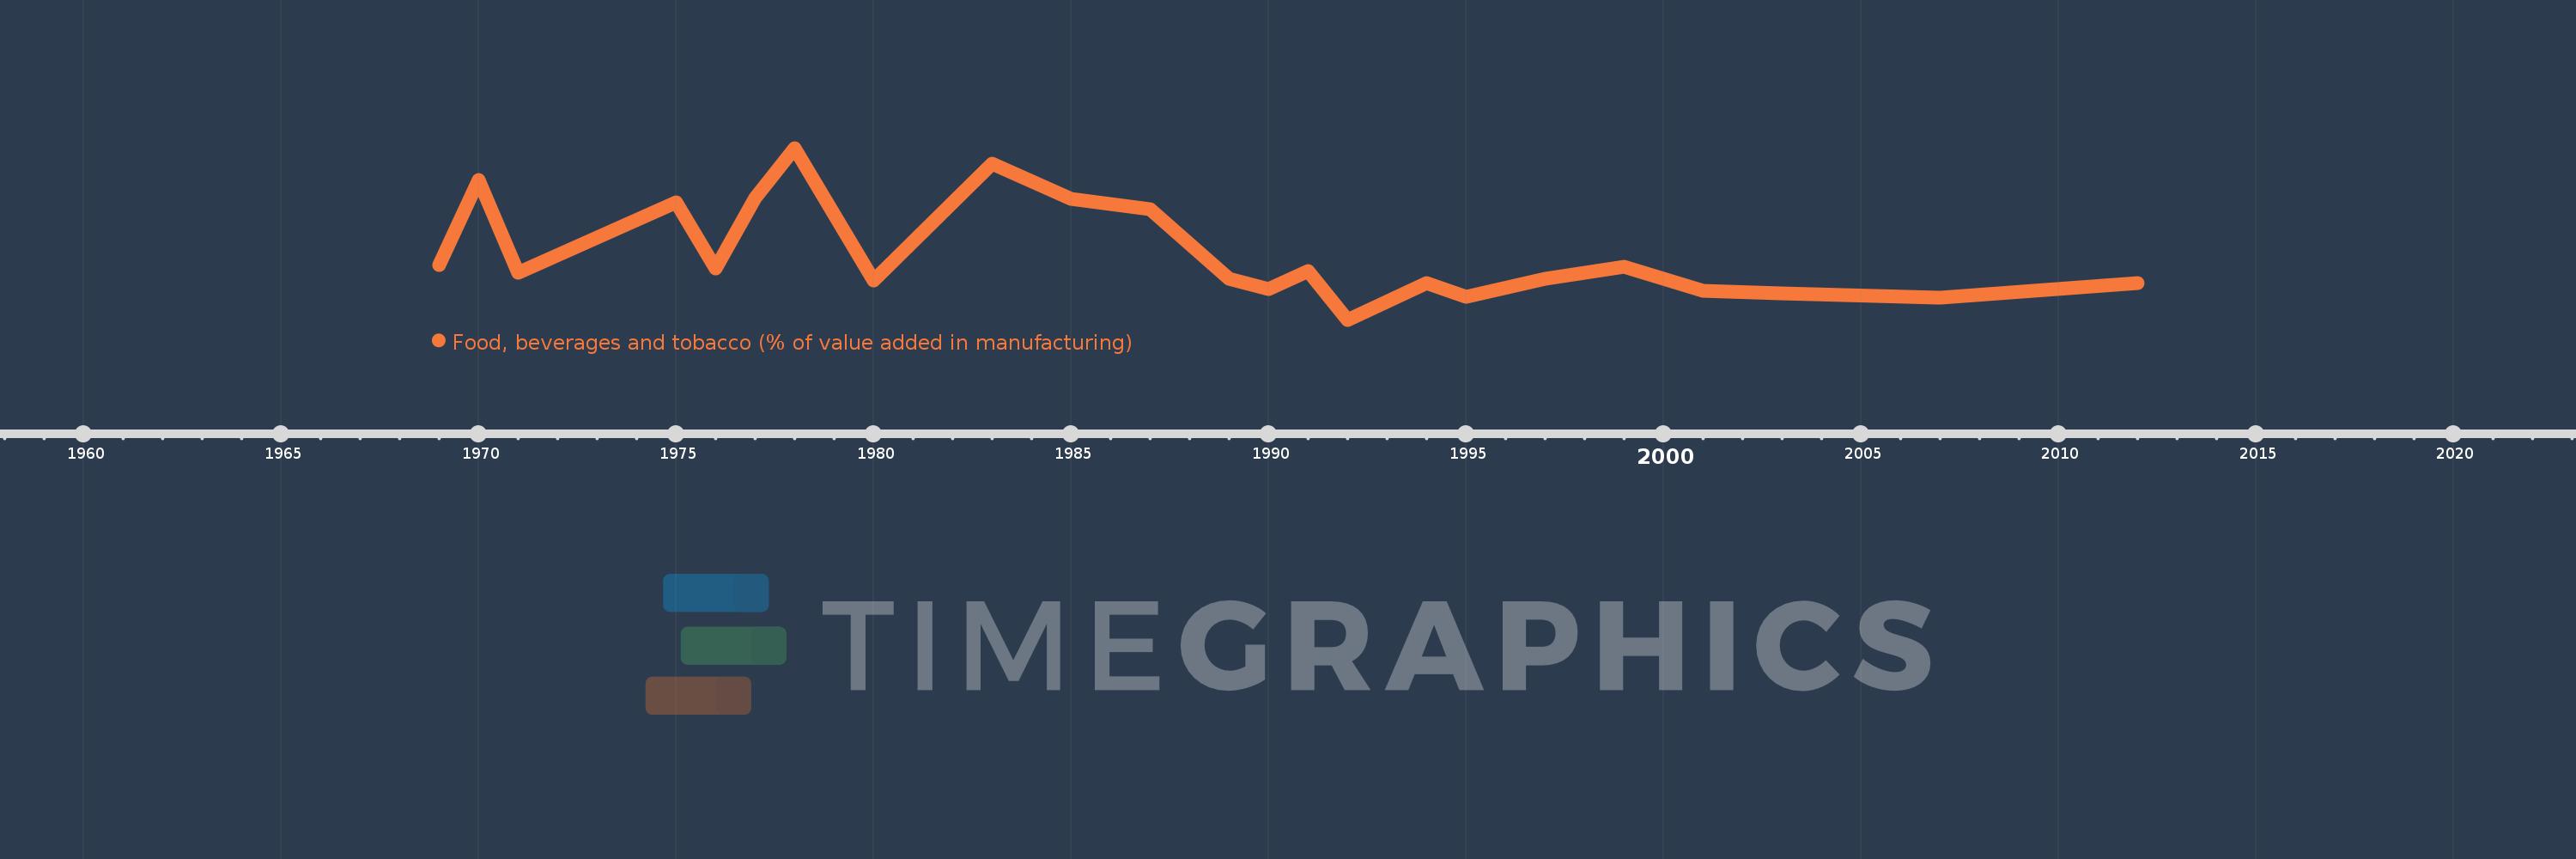
Food, beverages and tobacco (% of value added in manufacturing)
2012,2007,2003,2001,1999,1997,1995,1994,1992,1991,1990,1989,1987,1985,1983,1980,1978,1977,1976,1975,1971,1970,1969