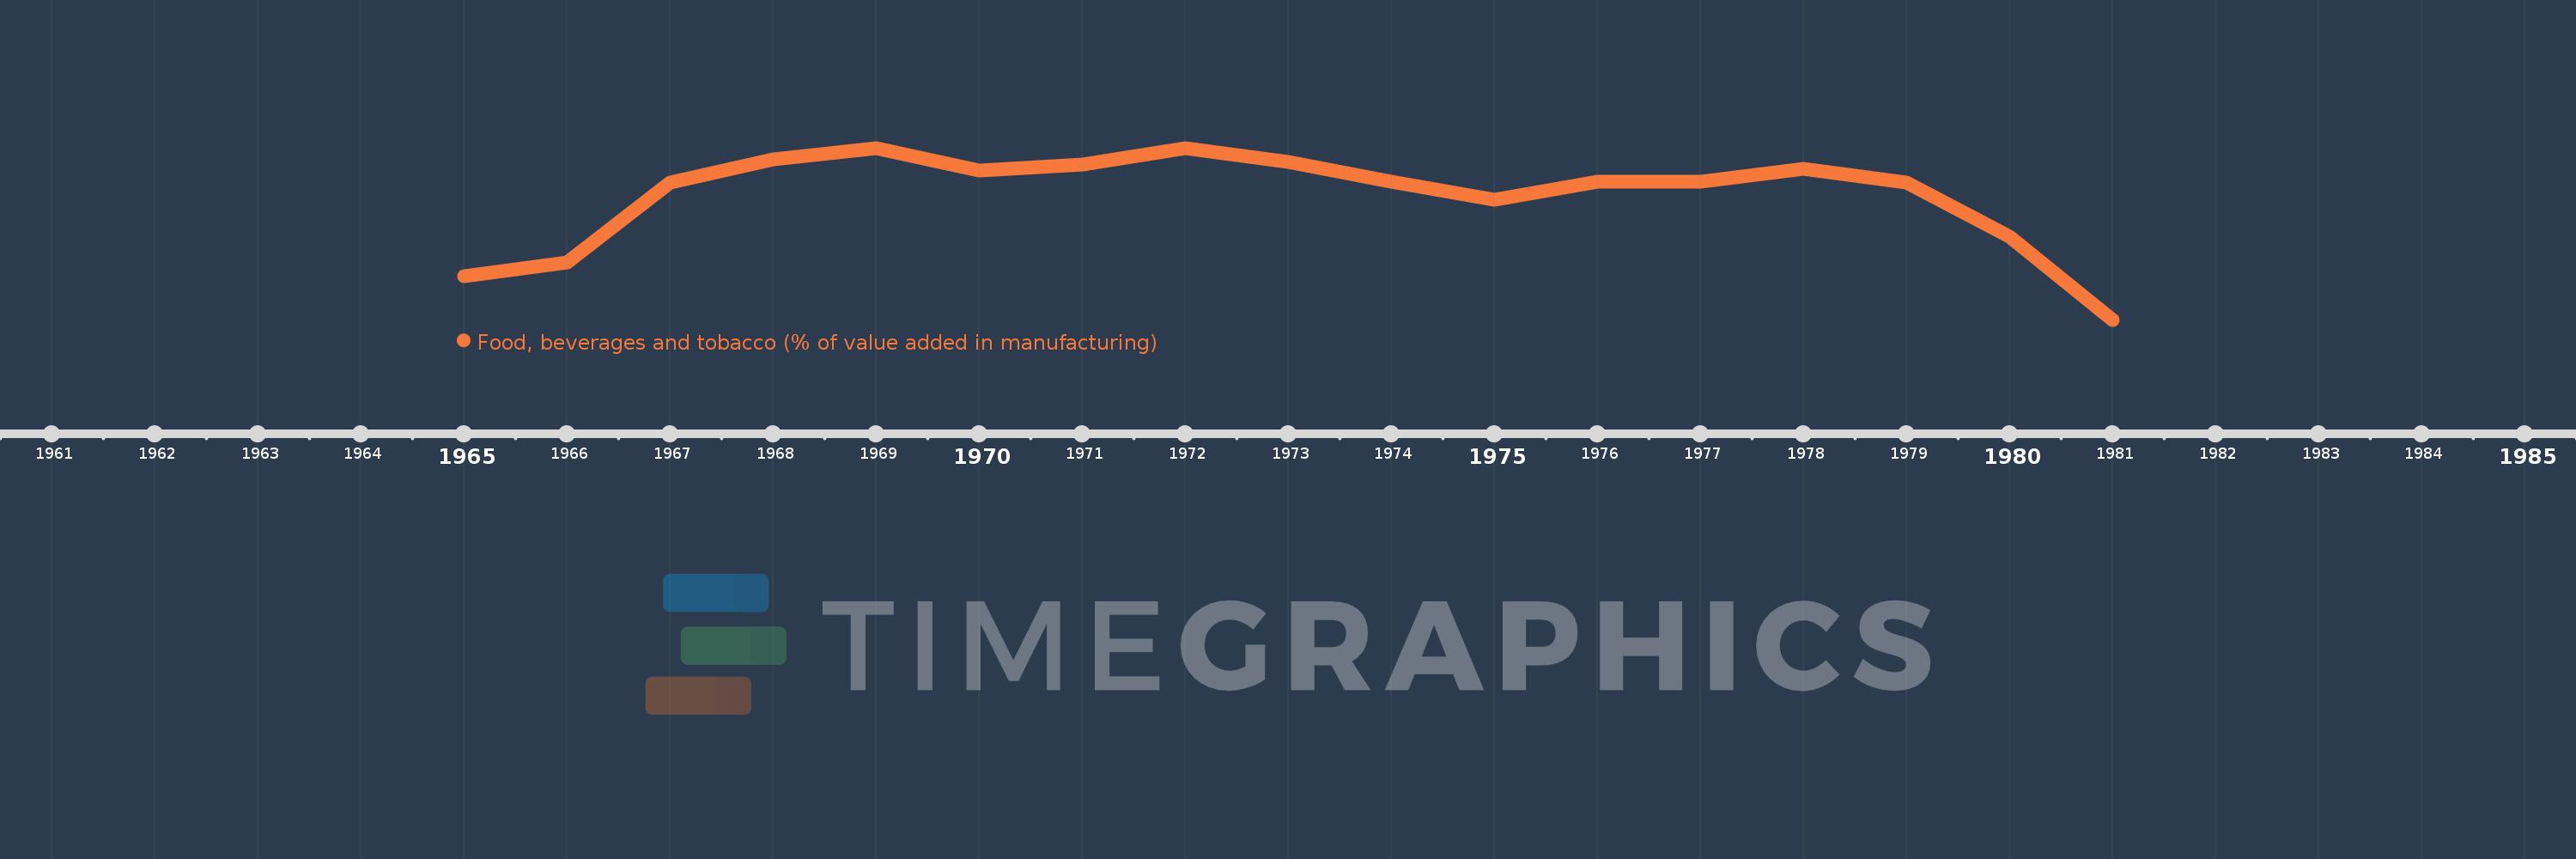
Questa scala temporale mostra un grafico dal 1965 anno al 1981 anno. Libya. I dati fino ad 1964 anno non disponibili. Il numero di osservazioni attuali secondo i date: 17.
La fonte (nome):
Indicatori dello sviluppo mondiale
La fonte (organizzazione):
United Nations Industrial Development Organization, International Yearbook of Industrial Statistics.
Categorie:
Economy & Growth
sono stati aggiornati
23 apr 2017 anni
Indicatori delle variazioni dei valori per anni
In media:
57.132
Minima:
30.871
1 gen 1981 anni
Massimo:
67.229
1 gen 1969 anni
Alla data di osservazione
Valore
Variazione assoluta
La variazione rispetto al valore precedente
1 gen 1965 anni
40.166
+40.166
0.0%
1 gen 1966 anni
43.025
+2.859
7.12%
1 gen 1967 anni
59.904
+16.879
39.23%
1 gen 1968 anni
64.74
+4.837
8.07%
1 gen 1969 anni
67.229
+2.488
3.84%
1 gen 1970 anni
62.45
-4.779
-7.11%
1 gen 1971 anni
63.793
+1.343
2.15%
1 gen 1972 anni
67.137
+3.344
5.24%
1 gen 1973 anni
64.313
-2.823
-4.21%
1 gen 1974 anni
60.05
-4.263
-6.63%
1 gen 1975 anni
56.315
-3.735
-6.22%
1 gen 1976 anni
59.997
+3.682
6.54%
1 gen 1977 anni
60.012
+0.015
0.02%
1 gen 1978 anni
62.894
+2.882
4.8%
1 gen 1979 anni
59.909
-2.985
-4.75%
1 gen 1980 anni
48.434
-11.474
-19.15%
1 gen 1981 anni
30.871
-17.564
-36.26%
Classificazione dei paesi secondo i statistiche attuali per anni