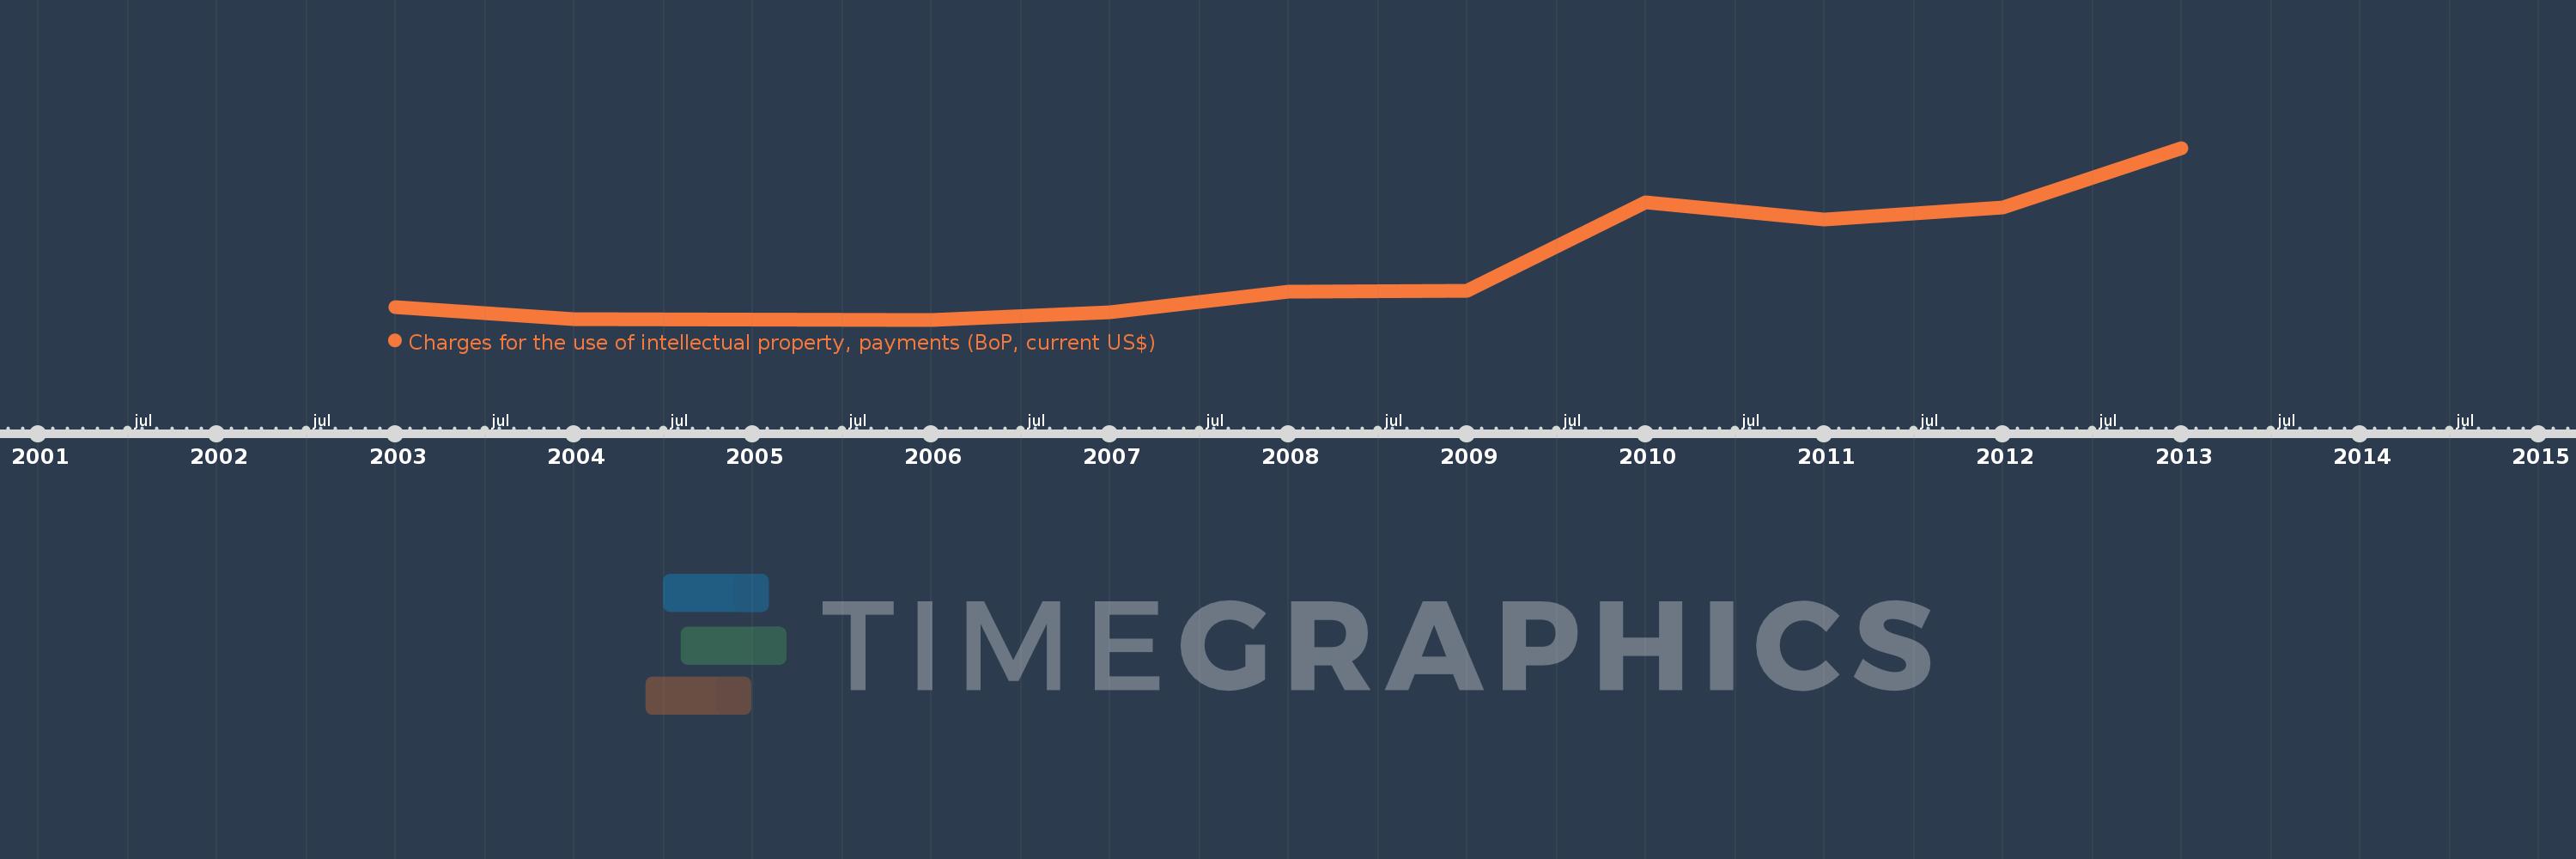
Questa scala temporale mostra un grafico dal 2003 anno al 2013 anno. Azerbaijan. I dati fino ad 2002 anno non disponibili. Il numero di osservazioni attuali secondo i date: 10.
La fonte (nome):
Indicatori dello sviluppo mondiale
La fonte (organizzazione):
International Monetary Fund, Balance of Payments Statistics Yearbook and data files.
Categorie:
Economy & Growth, Science & Technology
sono stati aggiornati
23 apr 2017 anni
Indicatori delle variazioni dei valori per anni
In media:
9.541 Mln
Minima:
46.0 Mille.
1 gen 2006 anni
Massimo:
28.18 Mln
1 gen 2013 anni
Alla data di osservazione
Valore
Variazione assoluta
La variazione rispetto al valore precedente
1 gen 2003 anni
2.05 Mln
+2.05 Mln
0.0%
1 gen 2004 anni
144.0 Mille.
-1.906 Mln
-92.98%
1 gen 2006 anni
46.0 Mille.
-98.0 Mille.
-68.06%
1 gen 2007 anni
1.281 Mln
+1.235 Mln
2.68 Mille.%
1 gen 2008 anni
4.697 Mln
+3.416 Mln
266.67%
1 gen 2009 anni
4.827 Mln
+130.0 Mille.
2.77%
1 gen 2010 anni
19.229 Mln
+14.402 Mln
298.36%
1 gen 2011 anni
16.531 Mln
-2.698 Mln
-14.03%
1 gen 2012 anni
18.423 Mln
+1.892 Mln
11.45%
1 gen 2013 anni
28.18 Mln
+9.757 Mln
52.96%
Classificazione dei paesi secondo i statistiche attuali per anni