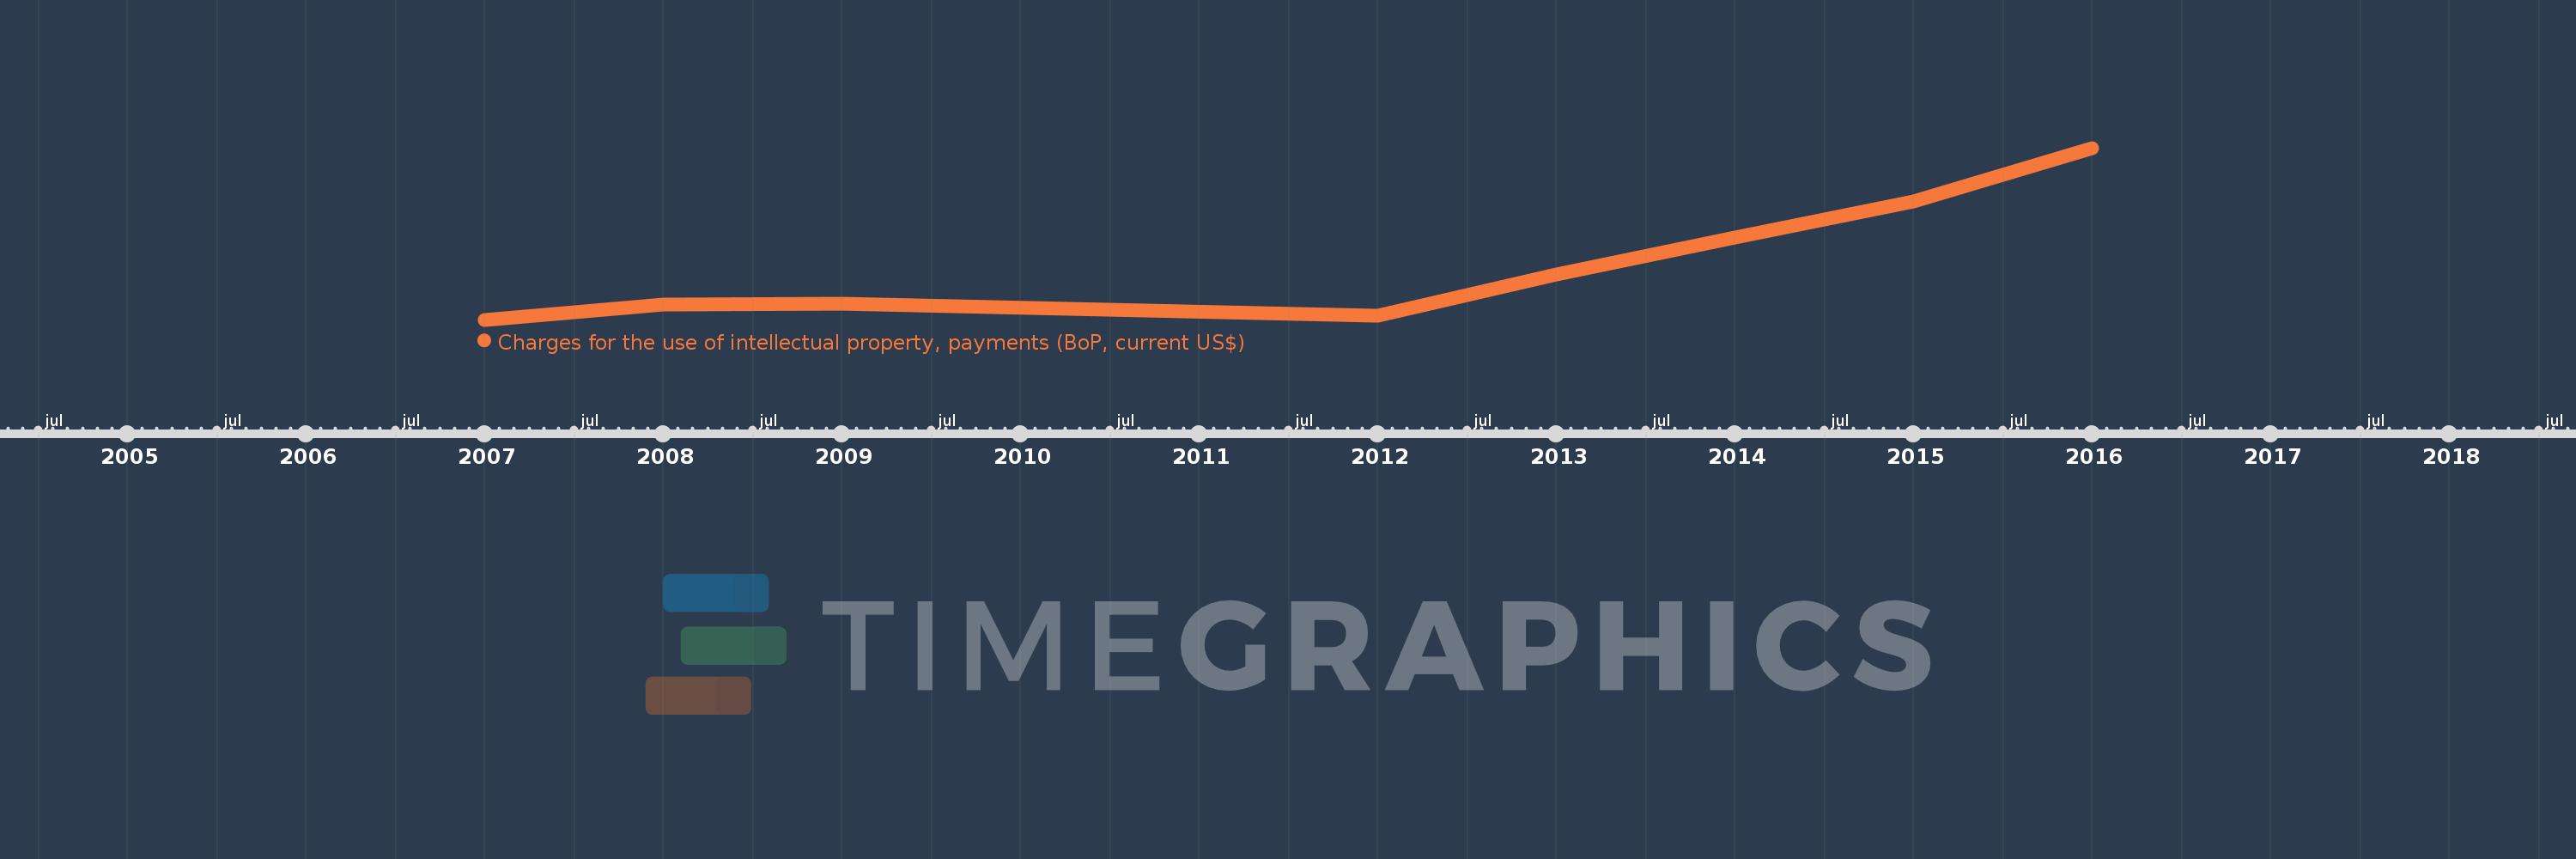
Questa scala temporale mostra un grafico dal 2007 anno al 2016 anno. Suriname. I dati fino ad 2006 anno non disponibili. Il numero di osservazioni attuali secondo i date: 8.
La fonte (nome):
Indicatori dello sviluppo mondiale
La fonte (organizzazione):
International Monetary Fund, Balance of Payments Statistics Yearbook and data files.
Categorie:
Economy & Growth, Science & Technology
sono stati aggiornati
23 apr 2017 anni
Indicatori delle variazioni dei valori per anni
In media:
7.048 Mln
Minima:
800.0 Mille.
1 gen 2007 anni
Massimo:
19.711 Mln
1 gen 2016 anni
Alla data di osservazione
Valore
Variazione assoluta
La variazione rispetto al valore precedente
1 gen 2007 anni
800.0 Mille.
+800.0 Mille.
0.0%
1 gen 2008 anni
2.5 Mln
+1.7 Mln
212.5%
1 gen 2009 anni
2.6 Mln
+100.0 Mille.
4.0%
1 gen 2012 anni
1.23 Mln
-1.37 Mln
-52.7%
1 gen 2013 anni
5.796 Mln
+4.567 Mln
371.31%
1 gen 2014 anni
9.885 Mln
+4.089 Mln
70.54%
1 gen 2015 anni
13.859 Mln
+3.974 Mln
40.2%
1 gen 2016 anni
19.711 Mln
+5.852 Mln
42.22%
Classificazione dei paesi secondo i statistiche attuali per anni