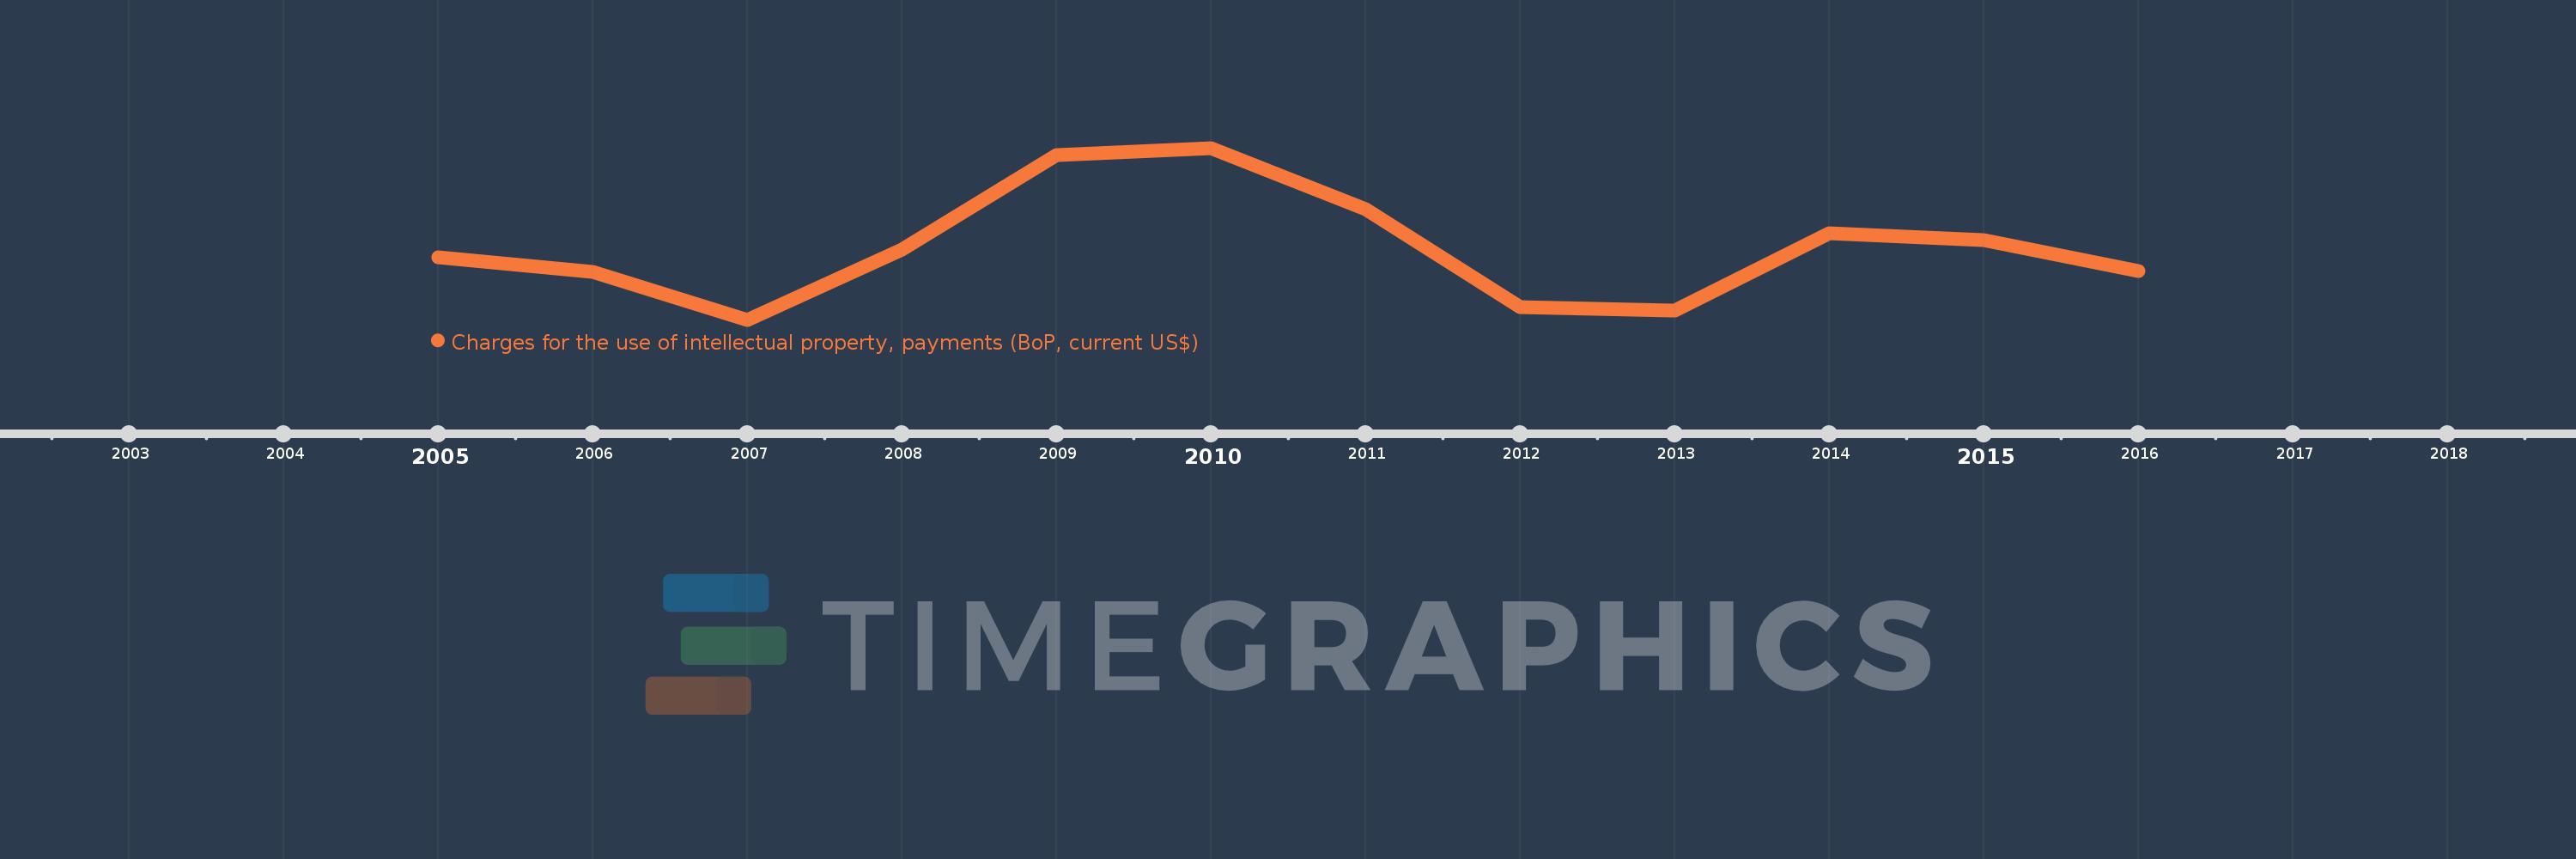
Questa scala temporale mostra un grafico dal 2005 anno al 2016 anno. Kosovo. I dati fino ad 2004 anno non disponibili. Il numero di osservazioni attuali secondo i date: 12.
La fonte (nome):
Indicatori dello sviluppo mondiale
La fonte (organizzazione):
International Monetary Fund, Balance of Payments Statistics Yearbook and data files.
Categorie:
Economy & Growth, Science & Technology
sono stati aggiornati
23 apr 2017 anni
Indicatori delle variazioni dei valori per anni
In media:
2.455 Mln
Minima:
115.914 Mille.
1 gen 2007 anni
Massimo:
5.693 Mln
1 gen 2010 anni
Alla data di osservazione
Valore
Variazione assoluta
La variazione rispetto al valore precedente
1 gen 2005 anni
2.148 Mln
+2.148 Mln
0.0%
1 gen 2006 anni
1.675 Mln
-472.625 Mille.
-22.0%
1 gen 2007 anni
115.914 Mille.
-1.56 Mln
-93.08%
1 gen 2008 anni
2.407 Mln
+2.291 Mln
1.98 Mille.%
1 gen 2009 anni
5.452 Mln
+3.045 Mln
126.53%
1 gen 2010 anni
5.693 Mln
+241.427 Mille.
4.43%
1 gen 2011 anni
3.706 Mln
-1.987 Mln
-34.9%
1 gen 2012 anni
515.573 Mille.
-3.191 Mln
-86.09%
1 gen 2013 anni
405.827 Mille.
-109.746 Mille.
-21.29%
1 gen 2014 anni
2.93 Mln
+2.524 Mln
622.01%
1 gen 2015 anni
2.711 Mln
-219.248 Mille.
-7.48%
1 gen 2016 anni
1.698 Mln
-1.013 Mln
-37.36%
Classificazione dei paesi secondo i statistiche attuali per anni