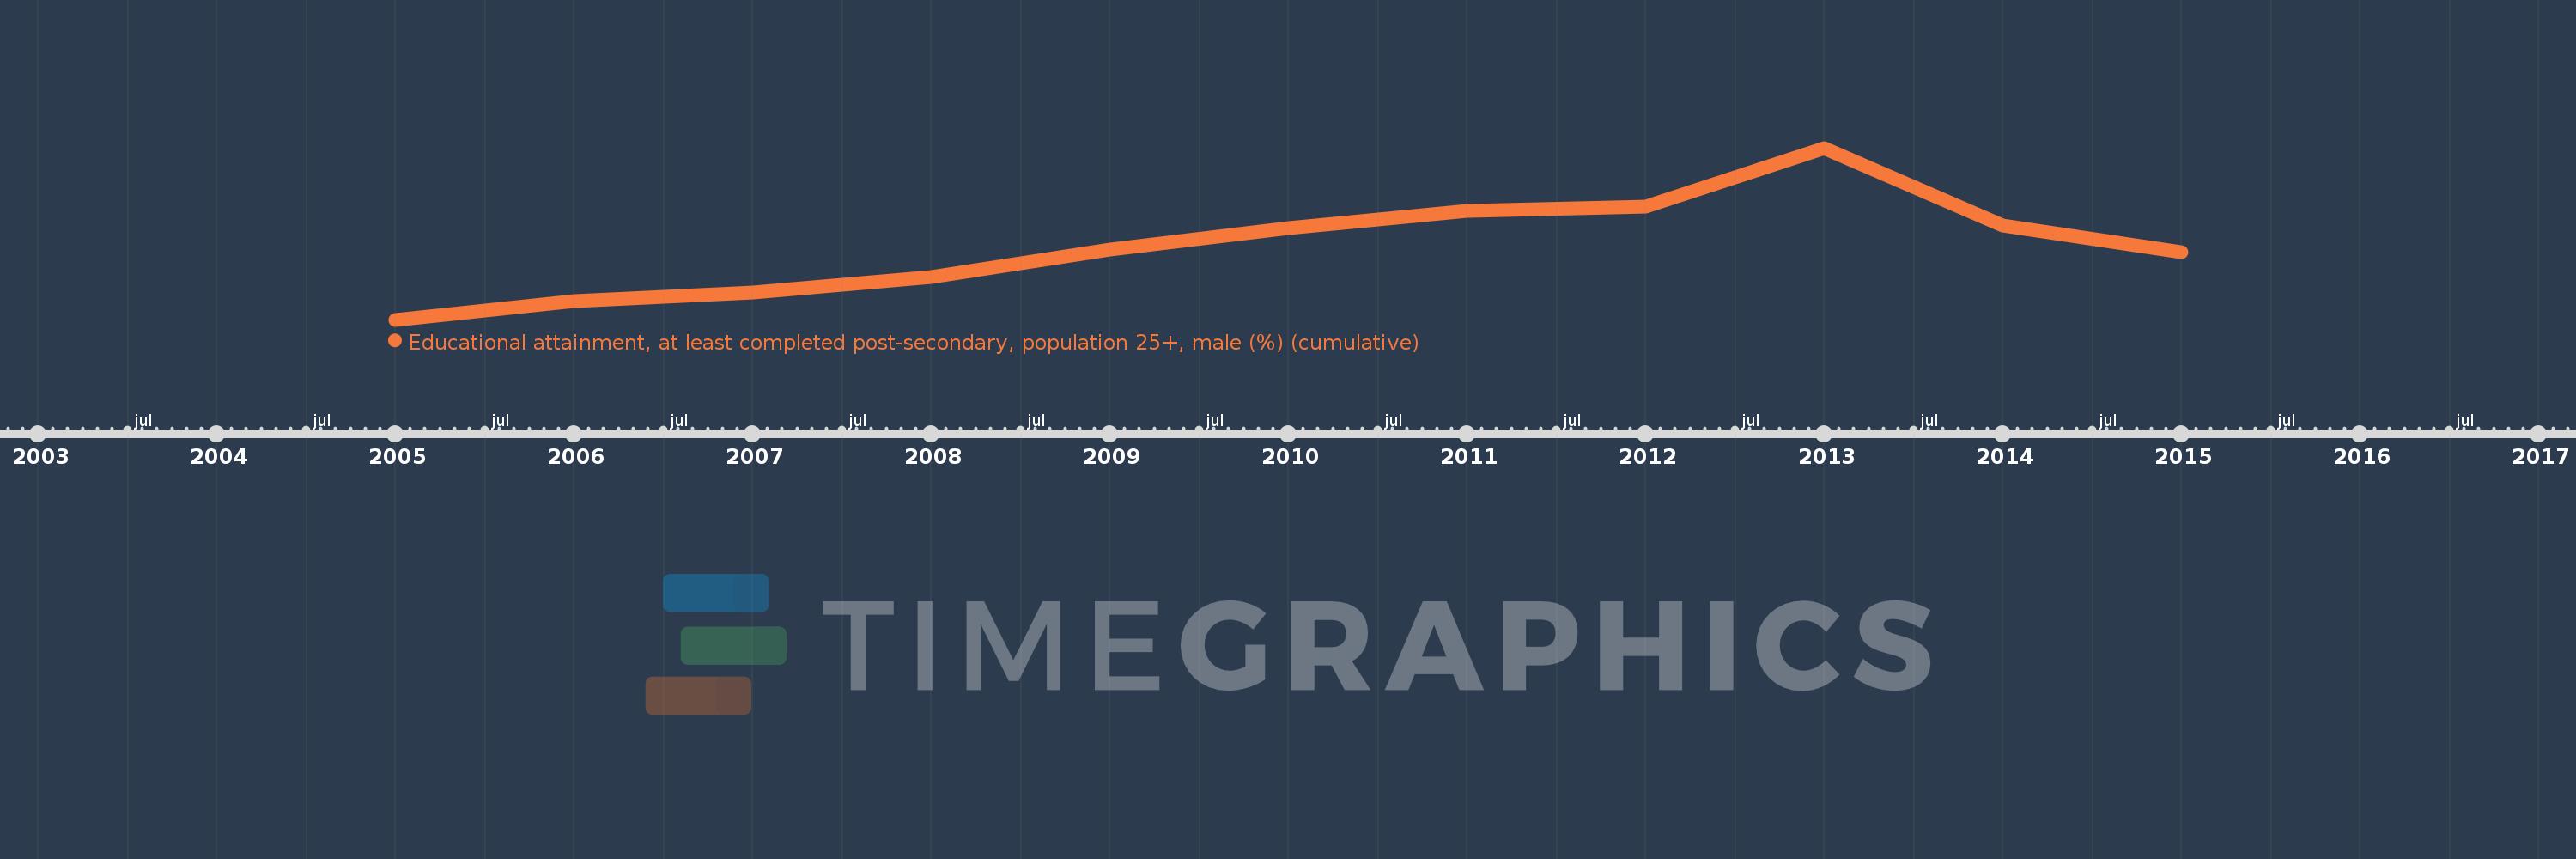
Questa scala temporale mostra un grafico dal 2005 anno al 2015 anno. Australia. I dati fino ad 2004 anno non disponibili. Il numero di osservazioni attuali secondo i date: 11.
La fonte (nome):
Indicatori dello sviluppo mondiale
La fonte (organizzazione):
United Nations Educational, Scientific, and Cultural Organization (UNESCO) Institute for Statistics.
Categorie:
Education, Gender
sono stati aggiornati
23 apr 2017 anni
Indicatori delle variazioni dei valori per anni
In media:
36.021
Minima:
30.989
1 gen 2005 anni
Massimo:
42.796
1 gen 2013 anni
Alla data di osservazione
Valore
Variazione assoluta
La variazione rispetto al valore precedente
1 gen 2005 anni
30.989
+30.989
0.0%
1 gen 2006 anni
32.297
+1.308
4.22%
1 gen 2007 anni
32.863
+0.566
1.75%
1 gen 2008 anni
33.907
+1.044
3.18%
1 gen 2009 anni
35.831
+1.924
5.67%
1 gen 2010 anni
37.26
+1.429
3.99%
1 gen 2011 anni
38.459
+1.2
3.22%
1 gen 2012 anni
38.767
+0.308
0.8%
1 gen 2013 anni
42.796
+4.028
10.39%
1 gen 2014 anni
37.455
-5.34
-12.48%
1 gen 2015 anni
35.606
-1.85
-4.94%
Classificazione dei paesi secondo i statistiche attuali per anni