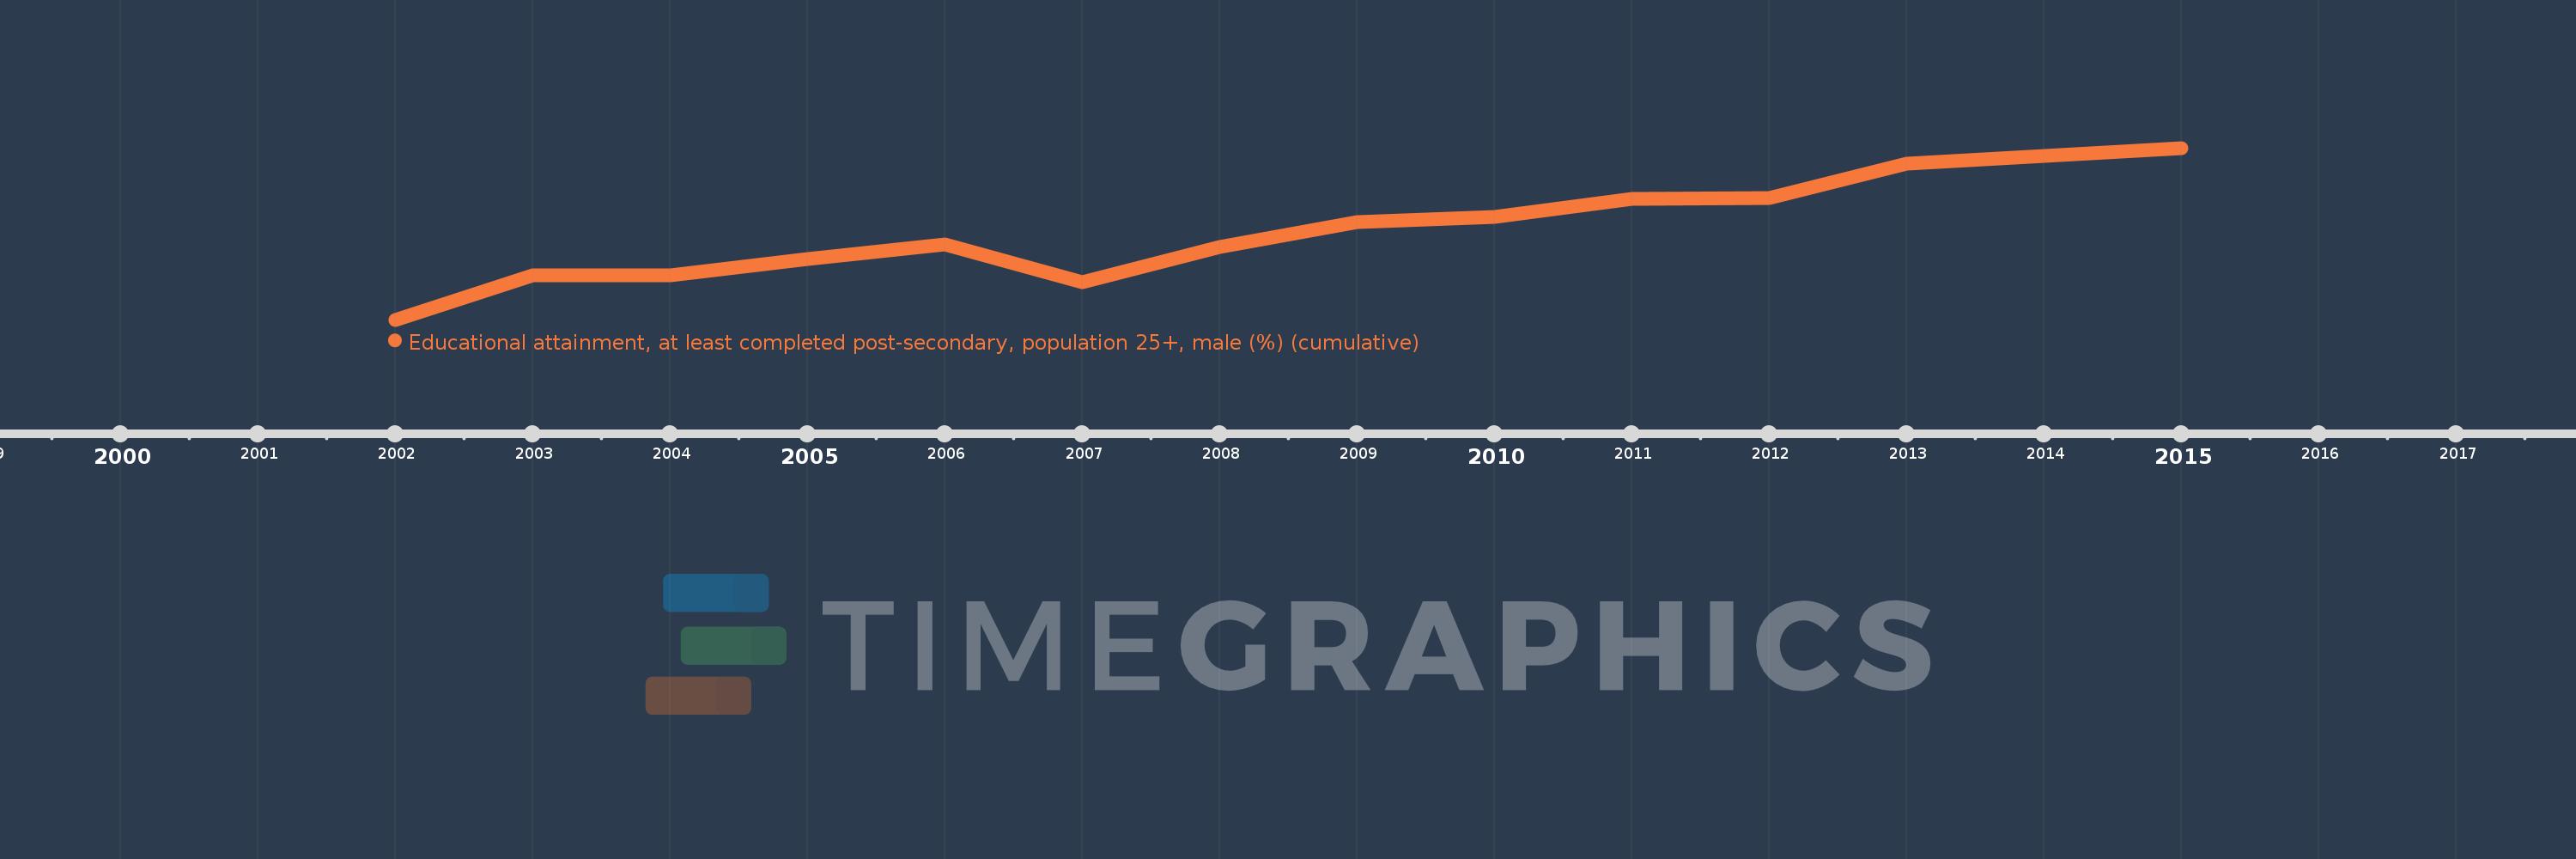
Questa scala temporale mostra un grafico dal 2002 anno al 2015 anno. South Africa. I dati fino ad 2001 anno non disponibili. Il numero di osservazioni attuali secondo i date: 13.
La fonte (nome):
Indicatori dello sviluppo mondiale
La fonte (organizzazione):
United Nations Educational, Scientific, and Cultural Organization (UNESCO) Institute for Statistics.
Categorie:
Education, Gender
sono stati aggiornati
23 apr 2017 anni
Indicatori delle variazioni dei valori per anni
In media:
11.924
Minima:
9.423
1 gen 2002 anni
Massimo:
14.471
1 gen 2015 anni
Alla data di osservazione
Valore
Variazione assoluta
La variazione rispetto al valore precedente
1 gen 2002 anni
9.423
+9.423
0.0%
1 gen 2003 anni
10.732
+1.309
13.9%
1 gen 2004 anni
10.72
-0.012
-0.11%
1 gen 2005 anni
11.21
+0.49
4.57%
1 gen 2006 anni
11.634
+0.424
3.78%
1 gen 2007 anni
10.538
-1.096
-9.42%
1 gen 2008 anni
11.562
+1.024
9.72%
1 gen 2009 anni
12.286
+0.724
6.26%
1 gen 2010 anni
12.452
+0.166
1.35%
1 gen 2011 anni
12.975
+0.523
4.2%
1 gen 2012 anni
13.0
+0.025
0.19%
1 gen 2013 anni
14.013
+1.013
7.79%
1 gen 2015 anni
14.471
+0.458
3.27%
Classificazione dei paesi secondo i statistiche attuali per anni