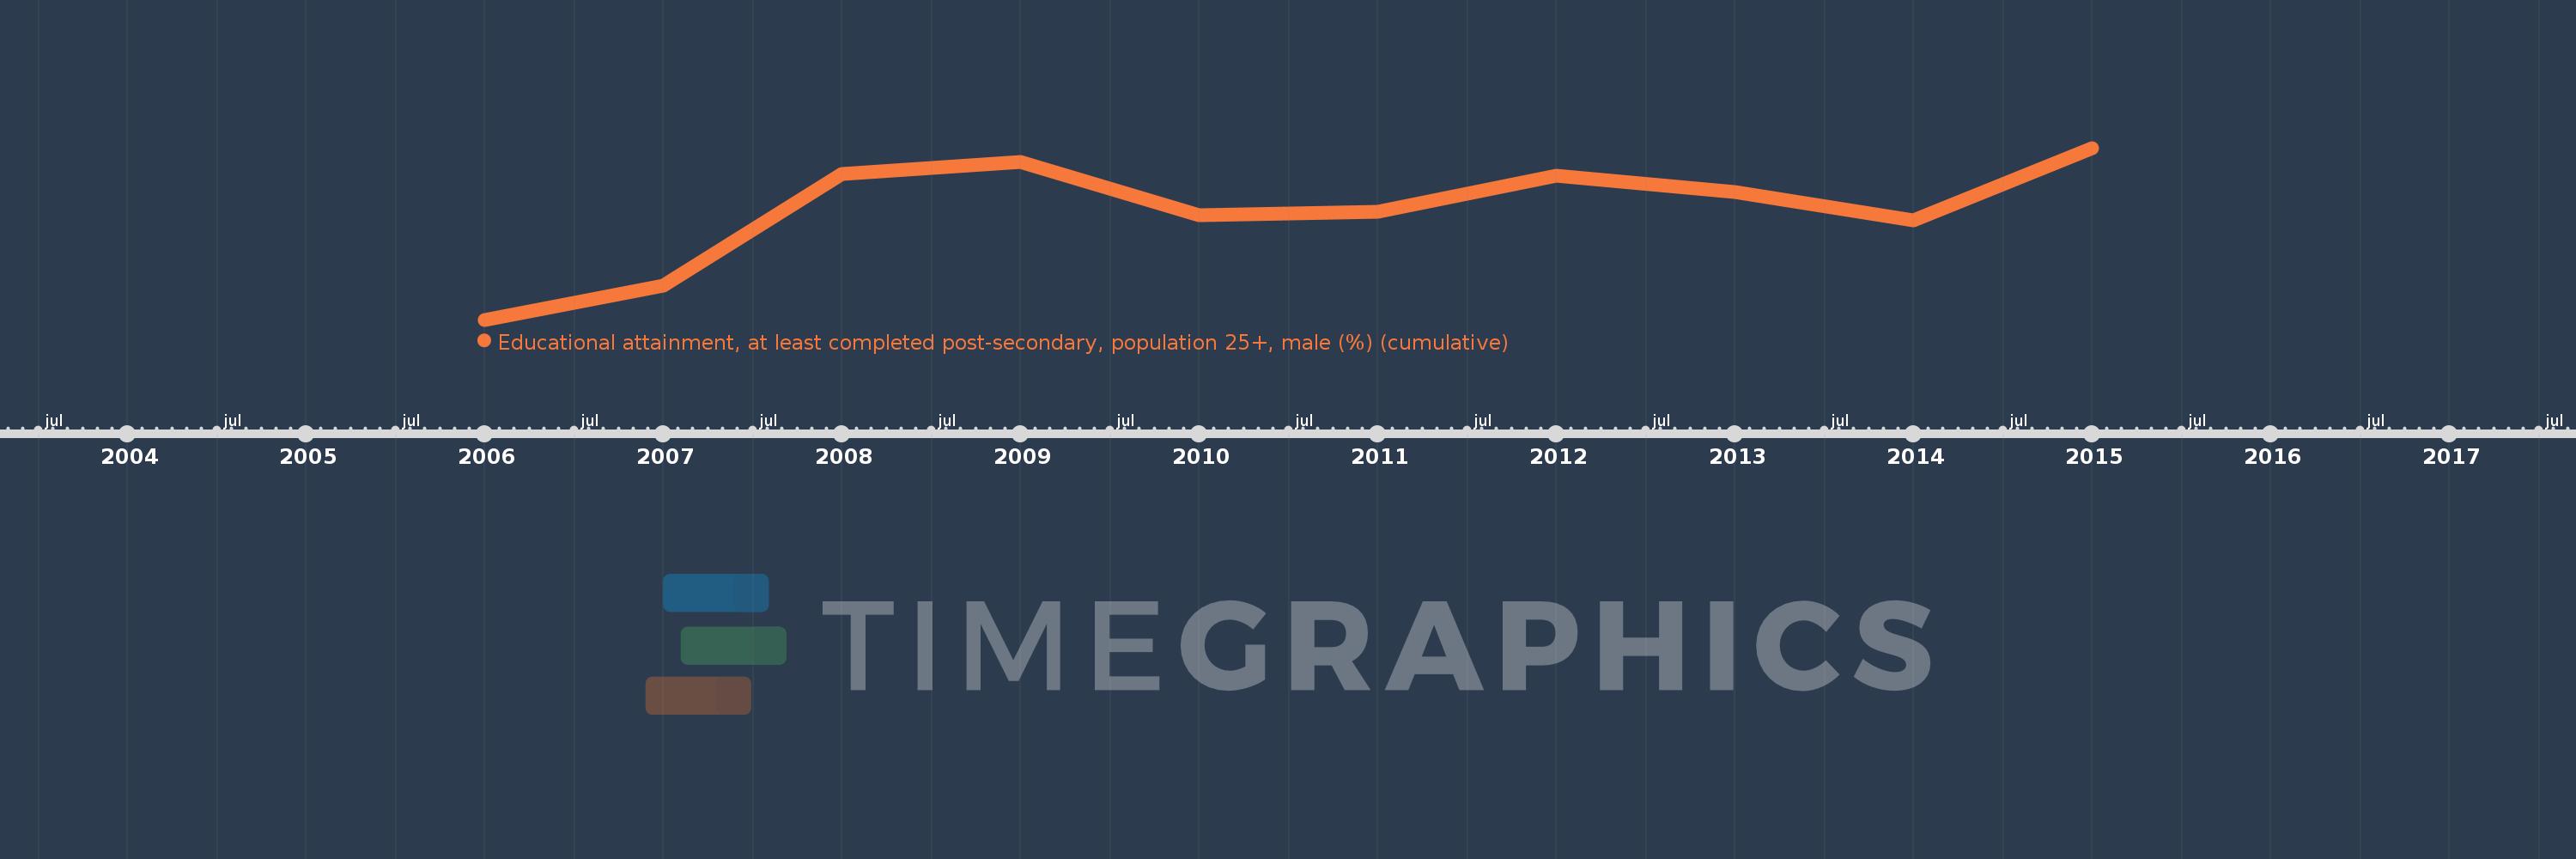
Questa scala temporale mostra un grafico dal 2006 anno al 2015 anno. Lithuania. I dati fino ad 2005 anno non disponibili. Il numero di osservazioni attuali secondo i date: 10.
La fonte (nome):
Indicatori dello sviluppo mondiale
La fonte (organizzazione):
United Nations Educational, Scientific, and Cultural Organization (UNESCO) Institute for Statistics.
Categorie:
Education, Gender
sono stati aggiornati
23 apr 2017 anni
Indicatori delle variazioni dei valori per anni
In media:
43.974
Minima:
41.893
1 gen 2006 anni
Massimo:
45.161
1 gen 2015 anni
Alla data di osservazione
Valore
Variazione assoluta
La variazione rispetto al valore precedente
1 gen 2006 anni
41.893
+41.893
0.0%
1 gen 2007 anni
42.546
+0.653
1.56%
1 gen 2008 anni
44.669
+2.123
4.99%
1 gen 2009 anni
44.9
+0.231
0.52%
1 gen 2010 anni
43.888
-1.012
-2.25%
1 gen 2011 anni
43.945
+0.057
0.13%
1 gen 2012 anni
44.634
+0.69
1.57%
1 gen 2013 anni
44.324
-0.311
-0.7%
1 gen 2014 anni
43.778
-0.546
-1.23%
1 gen 2015 anni
45.161
+1.383
3.16%
Classificazione dei paesi secondo i statistiche attuali per anni