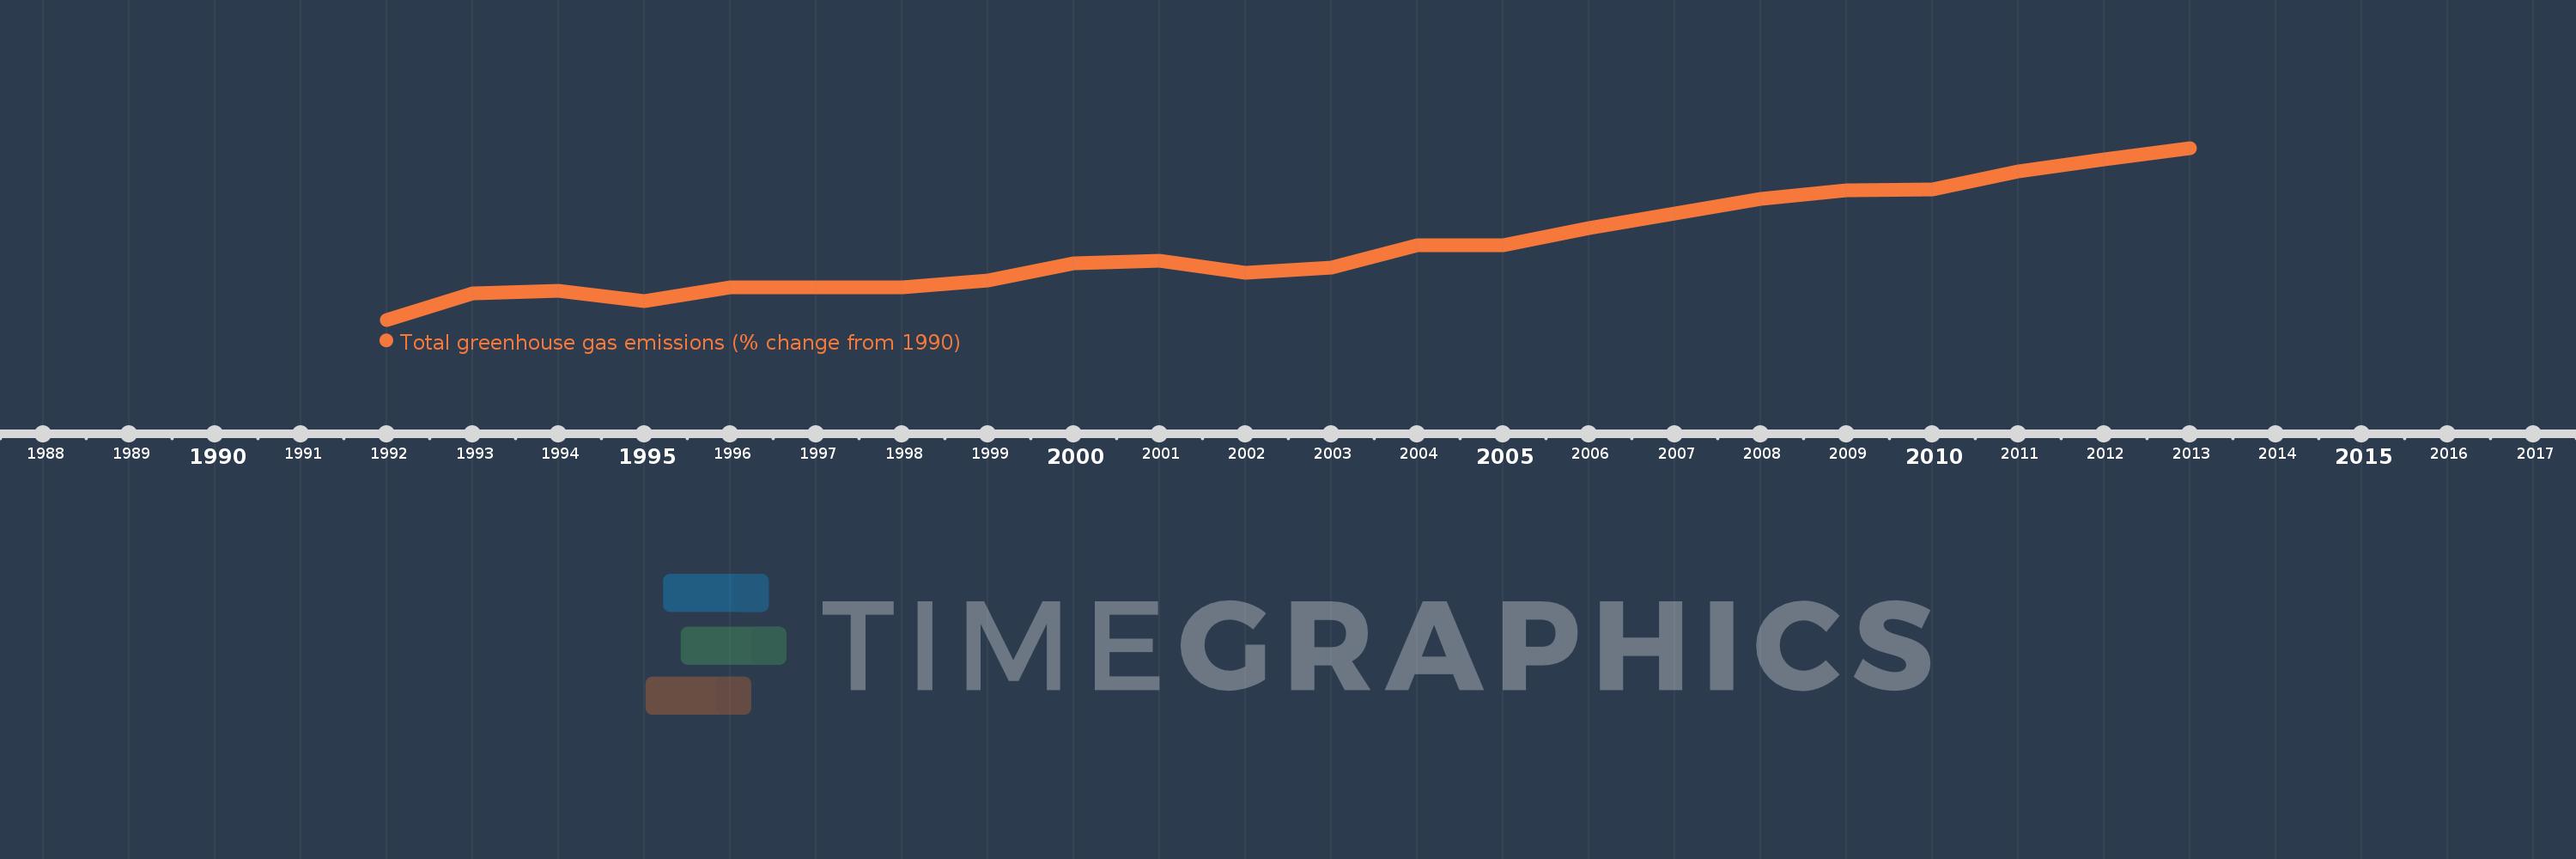
Questa scala temporale mostra un grafico dal 1992 anno al 2013 anno. Algeria. I dati fino ad 1991 anno non disponibili. Il numero di osservazioni attuali secondo i date: 22.
La fonte (nome):
Indicatori dello sviluppo mondiale
La fonte (organizzazione):
World Bank staff estimates from original source: European Commission, Joint Research Centre (JRC)/Netherlands Environmental Assessment Agency (PBL). Emission Database for Global Atmospheric Research (EDGAR): http://edgar.jrc.ec.europa.eu/.
Categorie:
Climate Change, Environment
sono stati aggiornati
23 apr 2017 anni
Indicatori delle variazioni dei valori per anni
In media:
31.179
Minima:
4.888
1 gen 1992 anni
Massimo:
65.785
1 gen 2013 anni
Alla data di osservazione
Valore
Variazione assoluta
La variazione rispetto al valore precedente
1 gen 1992 anni
4.888
+4.888
0.0%
1 gen 1993 anni
14.271
+9.382
191.95%
1 gen 1994 anni
15.073
+0.802
5.62%
1 gen 1995 anni
11.42
-3.653
-24.24%
1 gen 1996 anni
16.303
+4.883
42.75%
1 gen 1997 anni
16.236
-0.066
-0.41%
1 gen 1998 anni
16.464
+0.228
1.4%
1 gen 1999 anni
18.897
+2.433
14.78%
1 gen 2000 anni
24.753
+5.856
30.99%
1 gen 2001 anni
25.677
+0.924
3.73%
1 gen 2002 anni
21.503
-4.174
-16.26%
1 gen 2003 anni
23.276
+1.774
8.25%
1 gen 2004 anni
31.139
+7.863
33.78%
1 gen 2005 anni
31.378
+0.239
0.77%
1 gen 2006 anni
37.386
+6.008
19.15%
1 gen 2007 anni
42.472
+5.086
13.6%
1 gen 2008 anni
47.806
+5.334
12.56%
1 gen 2009 anni
50.701
+2.895
6.06%
1 gen 2010 anni
51.11
+0.408
0.81%
1 gen 2011 anni
57.521
+6.411
12.54%
1 gen 2012 anni
61.87
+4.349
7.56%
1 gen 2013 anni
65.785
+3.915
6.33%
Classificazione dei paesi secondo i statistiche attuali per anni