29
/it/
it
AIzaSyAYiBZKx7MnpbEhh9jyipgxe19OcubqV5w
April 1, 2024
198372
Moldova
MDA
true
2
1
Total greenhouse gas emissions (% change from 1990)
2013,2012,2011,2010,2009,2008,2007,2006,2005,2004,2003,2002,2001,2000,1999,1998,1997,1996,1995,1994,1993,1992
Download
Biblioteca di statistiche globali →Moldova →

Total greenhouse gas emissions (% change from 1990)

Queste statistiche in altri paesi:
AfghanistanAlbaniaAlgeriaAmerican SamoaAngolaAntigua and BarbudaArab WorldArgentinaArmeniaAustraliaAustriaAzerbaijanBahamas, TheBahrainBangladeshBarbadosBelarusBelgiumBelizeBeninBermudaBhutanBoliviaBosnia and HerzegovinaBotswanaBrazilBritish Virgin IslandsBrunei DarussalamBulgariaBurkina FasoBurundiCabo VerdeCambodiaCameroonCanadaCaribbean small statesCayman IslandsCentral African RepublicCentral Europe and the BalticsChadChileChinaColombiaComorosCongo, Dem. Rep.Congo, Rep.Costa RicaCote d'IvoireCroatiaCubaCyprusCzech RepublicDenmarkDjiboutiDominicaDominican RepublicEarly-demographic dividendEast Asia & PacificEast Asia & Pacific (excluding high income)East Asia & Pacific (IDA & IBRD countries)EcuadorEgypt, Arab Rep.El SalvadorEquatorial GuineaEritreaEstoniaEthiopiaEuro areaEurope & Central AsiaEurope & Central Asia (excluding high income)Europe & Central Asia (IDA & IBRD countries)European UnionFijiFinlandFragile and conflict affected situationsFranceFrench PolynesiaGabonGambia, TheGeorgiaGermanyGhanaGibraltarGreeceGrenadaGuamGuatemalaGuineaGuinea-BissauGuyanaHaitiHeavily indebted poor countries (HIPC)High incomeHondurasHong Kong SAR, ChinaHungaryIBRD onlyIcelandIDA & IBRD totalIDA blendIDA onlyIDA totalIndiaIndonesiaIran, Islamic Rep.IraqIrelandIsraelItalyJamaicaJapanJordanKazakhstanKenyaKiribatiKorea, Dem. People’s Rep.Korea, Rep.Kyrgyz RepublicLao PDRLate-demographic dividendLatin America & Caribbean Latin America & Caribbean (excluding high income)Latin America & the Caribbean (IDA & IBRD countries)LatviaLeast developed countries: UN classificationLesothoLiberiaLibyaLithuaniaLow & middle incomeLow incomeLower middle incomeLuxembourgMacedonia, FYRMadagascarMalawiMalaysiaMaliMaltaMauritaniaMauritiusMexicoMicronesia, Fed. Sts.Middle East & North AfricaMiddle East & North Africa (excluding high income)Middle East & North Africa (IDA & IBRD countries)Middle incomeMoldovaMongoliaMoroccoMozambiqueMyanmarNamibiaNepalNetherlandsNew CaledoniaNew ZealandNicaraguaNigerNigeriaNorth AmericaNorthern Mariana IslandsNorwayOECD membersOmanOther small statesPacific island small statesPakistanPanamaPapua New GuineaParaguayPeruPhilippinesPolandPortugalPost-demographic dividendPre-demographic dividendPuerto RicoQatarRomaniaRussian FederationRwandaSamoaSao Tome and PrincipeSenegalSeychellesSierra LeoneSlovak RepublicSloveniaSmall statesSolomon IslandsSomaliaSouth AfricaSouth AsiaSouth Asia (IDA & IBRD)SpainSri LankaSt. LuciaSt. Vincent and the GrenadinesSub-Saharan Africa Sub-Saharan Africa (excluding high income)Sub-Saharan Africa (IDA & IBRD countries)SudanSurinameSwazilandSwedenSwitzerlandSyrian Arab RepublicTajikistanTanzaniaThailandTimor-LesteTogoTongaTunisiaTurkeyTurkmenistanTurks and Caicos IslandsTuvaluUgandaUkraineUnited Arab EmiratesUnited KingdomUnited StatesUpper middle incomeUruguayUzbekistanVanuatuVenezuela, RBVietnamVirgin Islands (U.S.)WorldYemen, Rep.ZambiaZimbabwe
Linea del tempo:
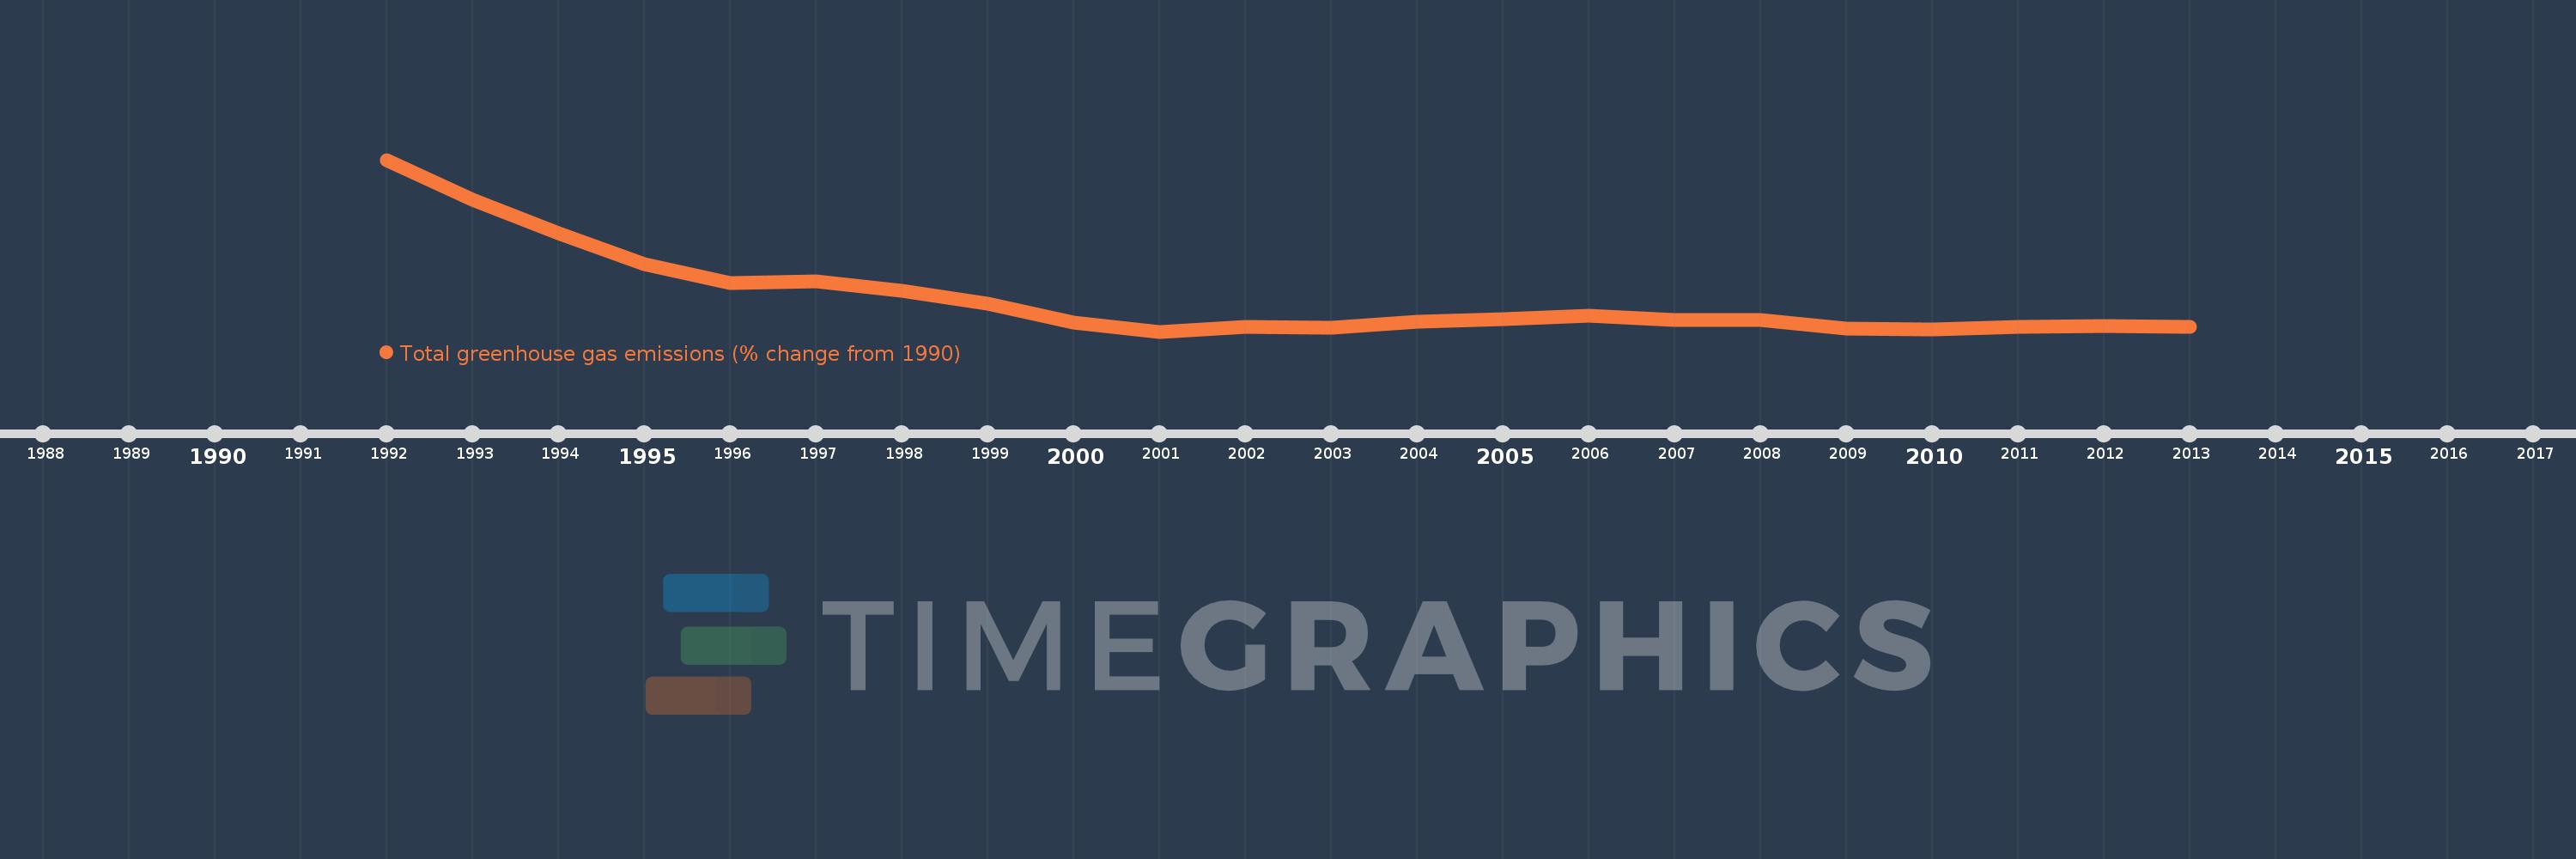
Questa scala temporale mostra un grafico dal 1992 anno al 2013 anno. Moldova. I dati fino ad 1991 anno non disponibili. Il numero di osservazioni attuali secondo i date: 22.
La fonte (nome):
Indicatori dello sviluppo mondiale
La fonte (organizzazione):
World Bank staff estimates from original source: European Commission, Joint Research Centre (JRC)/Netherlands Environmental Assessment Agency (PBL). Emission Database for Global Atmospheric Research (EDGAR): http://edgar.jrc.ec.europa.eu/.
Categorie:
Climate Change, Environment
sono stati aggiornati
23 apr 2017 anni
Indicatori delle variazioni dei valori per anni
In media:
-60.933
Minima:
-71.611
1 gen 2001 anni
Massimo:
-16.786
1 gen 1992 anni
Alla data di osservazione
Valore
Variazione assoluta
La variazione rispetto al valore precedente
1 gen 1992 anni
-16.786
-16.786
0.0%
1 gen 1993 anni
-29.441
-12.654
75.39%
1 gen 1994 anni
-40.114
-10.674
36.26%
1 gen 1995 anni
-50.003
-9.888
24.65%
1 gen 1996 anni
-56.214
-6.211
12.42%
1 gen 1997 anni
-55.522
+0.691
-1.23%
1 gen 1998 anni
-58.611
-3.089
5.56%
1 gen 1999 anni
-62.644
-4.033
6.88%
1 gen 2000 anni
-68.817
-6.172
9.85%
1 gen 2001 anni
-71.611
-2.795
4.06%
1 gen 2002 anni
-70.097
+1.514
-2.11%
1 gen 2003 anni
-70.34
-0.243
0.35%
1 gen 2004 anni
-68.456
+1.885
-2.68%
1 gen 2005 anni
-67.65
+0.806
-1.18%
1 gen 2006 anni
-66.44
+1.21
-1.79%
1 gen 2007 anni
-67.805
-1.365
2.05%
1 gen 2008 anni
-68.015
-0.21
0.31%
1 gen 2009 anni
-70.628
-2.613
3.84%
1 gen 2010 anni
-71.052
-0.425
0.6%
1 gen 2011 anni
-70.185
+0.868
-1.22%
1 gen 2012 anni
-69.935
+0.249
-0.36%
1 gen 2013 anni
-70.153
-0.218
0.31%
Classificazione dei paesi secondo i statistiche attuali per anni

Commenti:

Inviare
PremiumAbout & FeedbackAccordoPrivatezza
logo
© 2022 Selected Technologies LLC – Morgan Hill, California