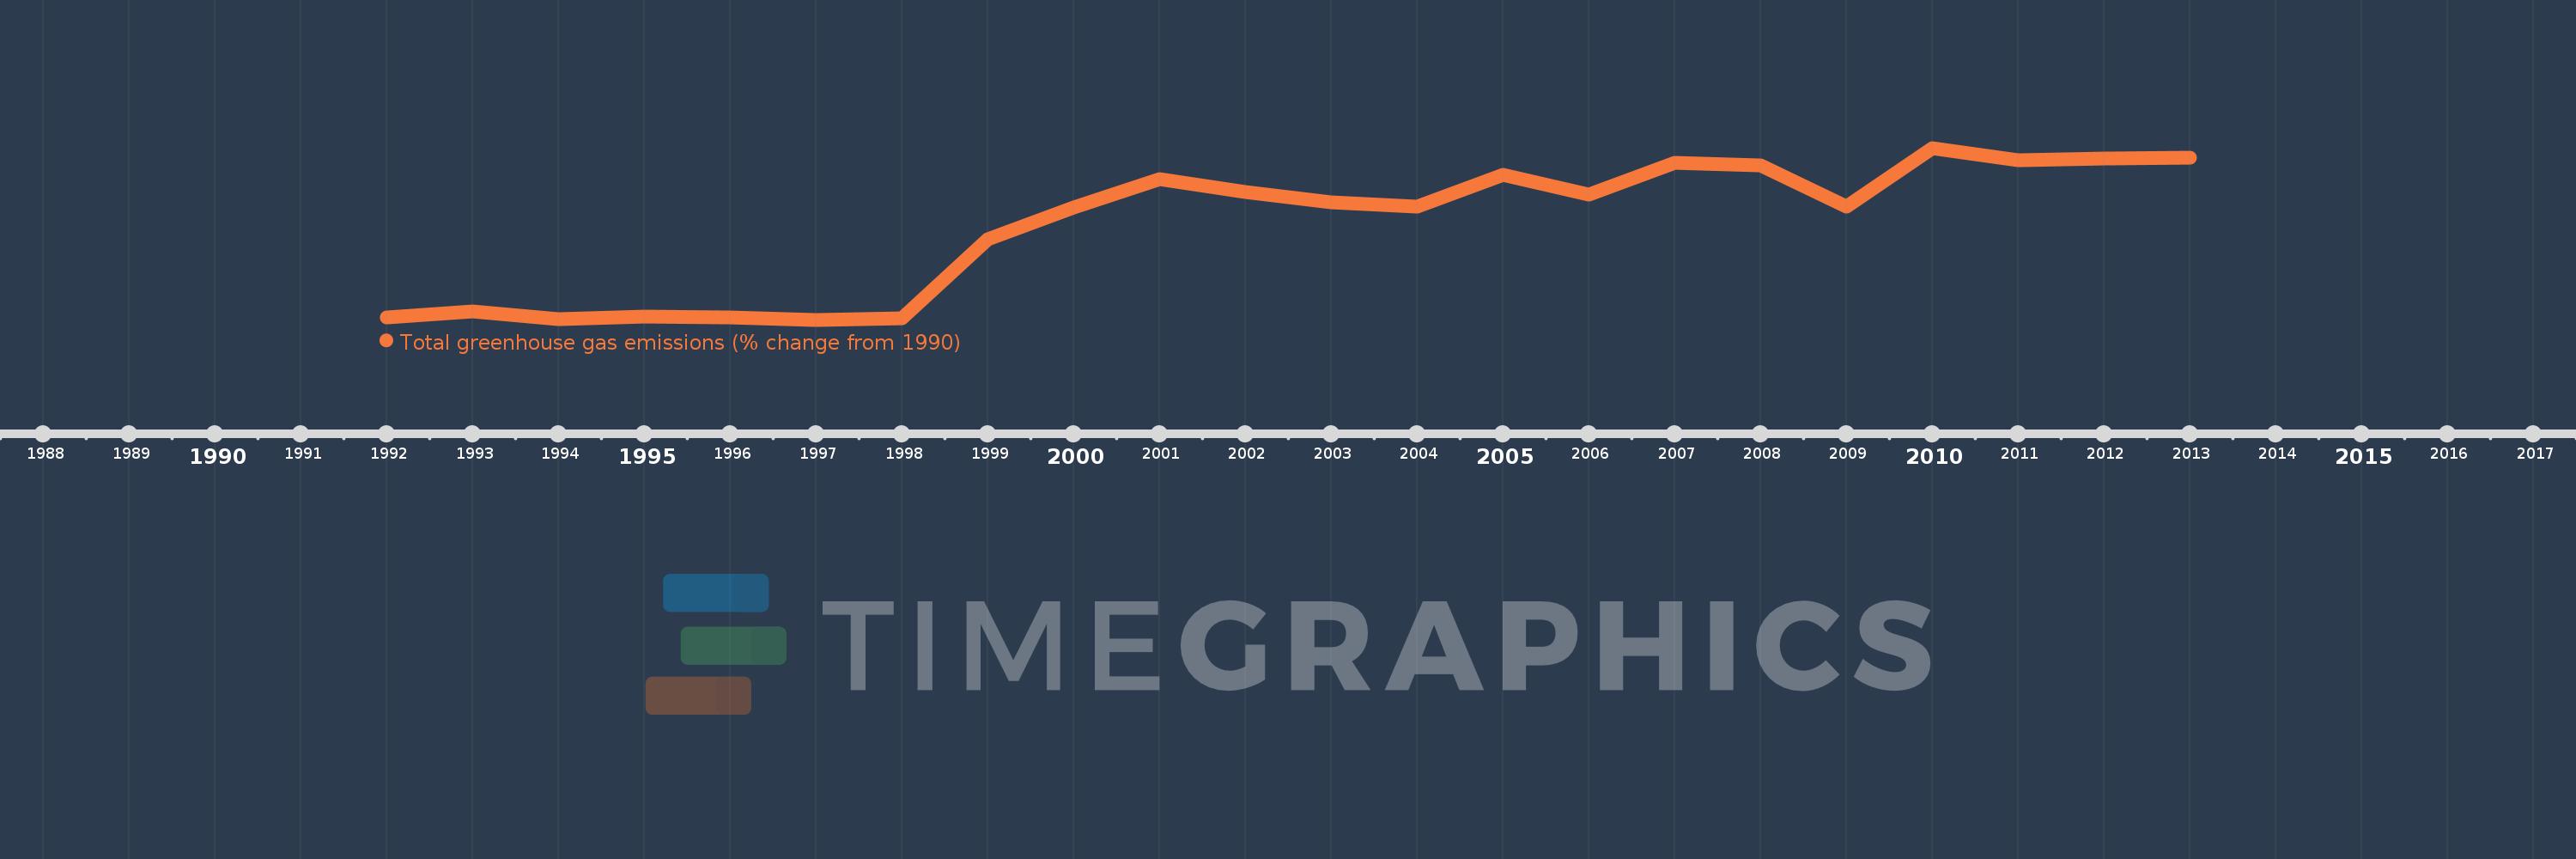
Questa scala temporale mostra un grafico dal 1992 anno al 2013 anno. Namibia. I dati fino ad 1991 anno non disponibili. Il numero di osservazioni attuali secondo i date: 22.
La fonte (nome):
Indicatori dello sviluppo mondiale
La fonte (organizzazione):
World Bank staff estimates from original source: European Commission, Joint Research Centre (JRC)/Netherlands Environmental Assessment Agency (PBL). Emission Database for Global Atmospheric Research (EDGAR): http://edgar.jrc.ec.europa.eu/.
Categorie:
Climate Change, Environment
sono stati aggiornati
23 apr 2017 anni
Indicatori delle variazioni dei valori per anni
In media:
240.202
Minima:
-7.987
1 gen 1997 anni
Massimo:
447.561
1 gen 2010 anni
Alla data di osservazione
Valore
Variazione assoluta
La variazione rispetto al valore precedente
1 gen 1992 anni
-0.728
-0.728
0.0%
1 gen 1993 anni
14.651
+15.379
-2.11 Mille.%
1 gen 1994 anni
-5.416
-20.066
-136.96%
1 gen 1995 anni
-0.002
+5.413
-99.96%
1 gen 1996 anni
-0.752
-0.75
31.13 Mille.%
1 gen 1997 anni
-7.987
-7.234
961.35%
1 gen 1998 anni
-3.771
+4.216
-52.78%
1 gen 1999 anni
204.648
+208.419
-5.53 Mille.%
1 gen 2000 anni
288.863
+84.215
41.15%
1 gen 2001 anni
365.558
+76.695
26.55%
1 gen 2002 anni
329.583
-35.975
-9.84%
1 gen 2003 anni
304.076
-25.506
-7.74%
1 gen 2004 anni
292.252
-11.824
-3.89%
1 gen 2005 anni
376.047
+83.795
28.67%
1 gen 2006 anni
323.757
-52.29
-13.91%
1 gen 2007 anni
408.027
+84.27
26.03%
1 gen 2008 anni
400.84
-7.186
-1.76%
1 gen 2009 anni
291.721
-109.119
-27.22%
1 gen 2010 anni
447.561
+155.84
53.42%
1 gen 2011 anni
415.724
-31.838
-7.11%
1 gen 2012 anni
418.574
+2.85
0.69%
1 gen 2013 anni
421.226
+2.652
0.63%
Classificazione dei paesi secondo i statistiche attuali per anni