Download Queste statistiche in altri paesi:
Linea del tempo:
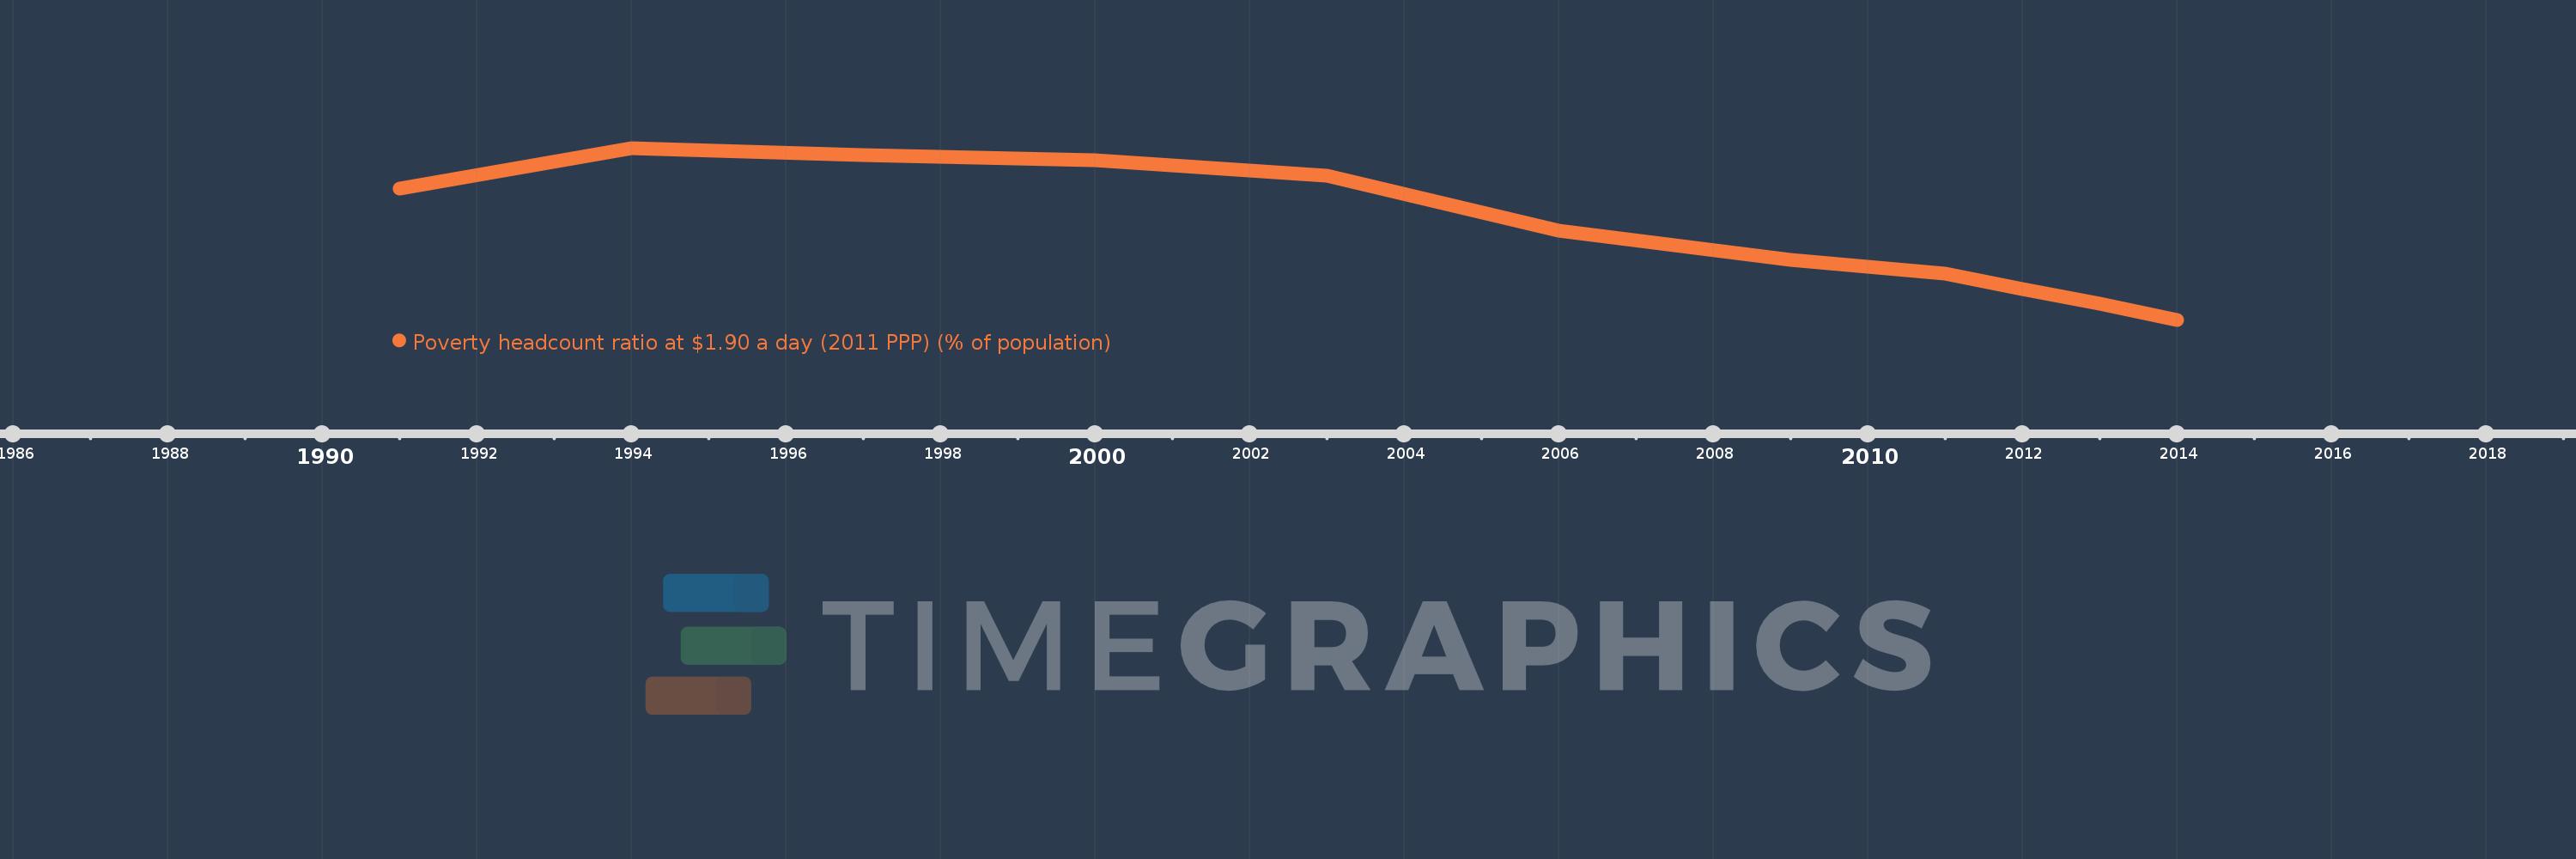
Questa scala temporale mostra un grafico dal 1991 anno al 2014 anno. Sub-Saharan Africa . I dati fino ad 1990 anno non disponibili. Il numero di osservazioni attuali secondo i date: 11.
La fonte (nome):
Indicatori dello sviluppo mondiale
La fonte (organizzazione):
World Bank, Development Research Group. Data are based on primary household survey data obtained from government statistical agencies and World Bank country departments. Data for high-income economies are from the Luxembourg Income Study database. For more information and methodology, please see PovcalNet (http://iresearch.worldbank.org/PovcalNet/index.htm).
Categorie:
Poverty, Aid Effectiveness, Climate Change
sono stati aggiornati
23 apr 2017 anni
Indicatori delle variazioni dei valori per anni
Minima:
40.99
1 gen 2014 anni
Massimo:
58.39
1 gen 1994 anni
Alla data di osservazione
Valore
Variazione assoluta
La variazione rispetto al valore precedente
1 gen 1991 anni
54.28
+54.28
0.0%
1 gen 1994 anni
58.39
+4.11
7.57%
1 gen 1997 anni
57.69
-0.7
-1.2%
1 gen 2000 anni
57.12
-0.57
-0.99%
1 gen 2003 anni
55.58
-1.54
-2.7%
1 gen 2006 anni
50.04
-5.54
-9.97%
1 gen 2009 anni
47.03
-3.01
-6.02%
1 gen 2011 anni
45.68
-1.35
-2.87%
1 gen 2012 anni
44.06
-1.62
-3.55%
1 gen 2013 anni
42.6
-1.46
-3.31%
1 gen 2014 anni
40.99
-1.61
-3.78%
Classificazione dei paesi secondo i statistiche attuali per anni