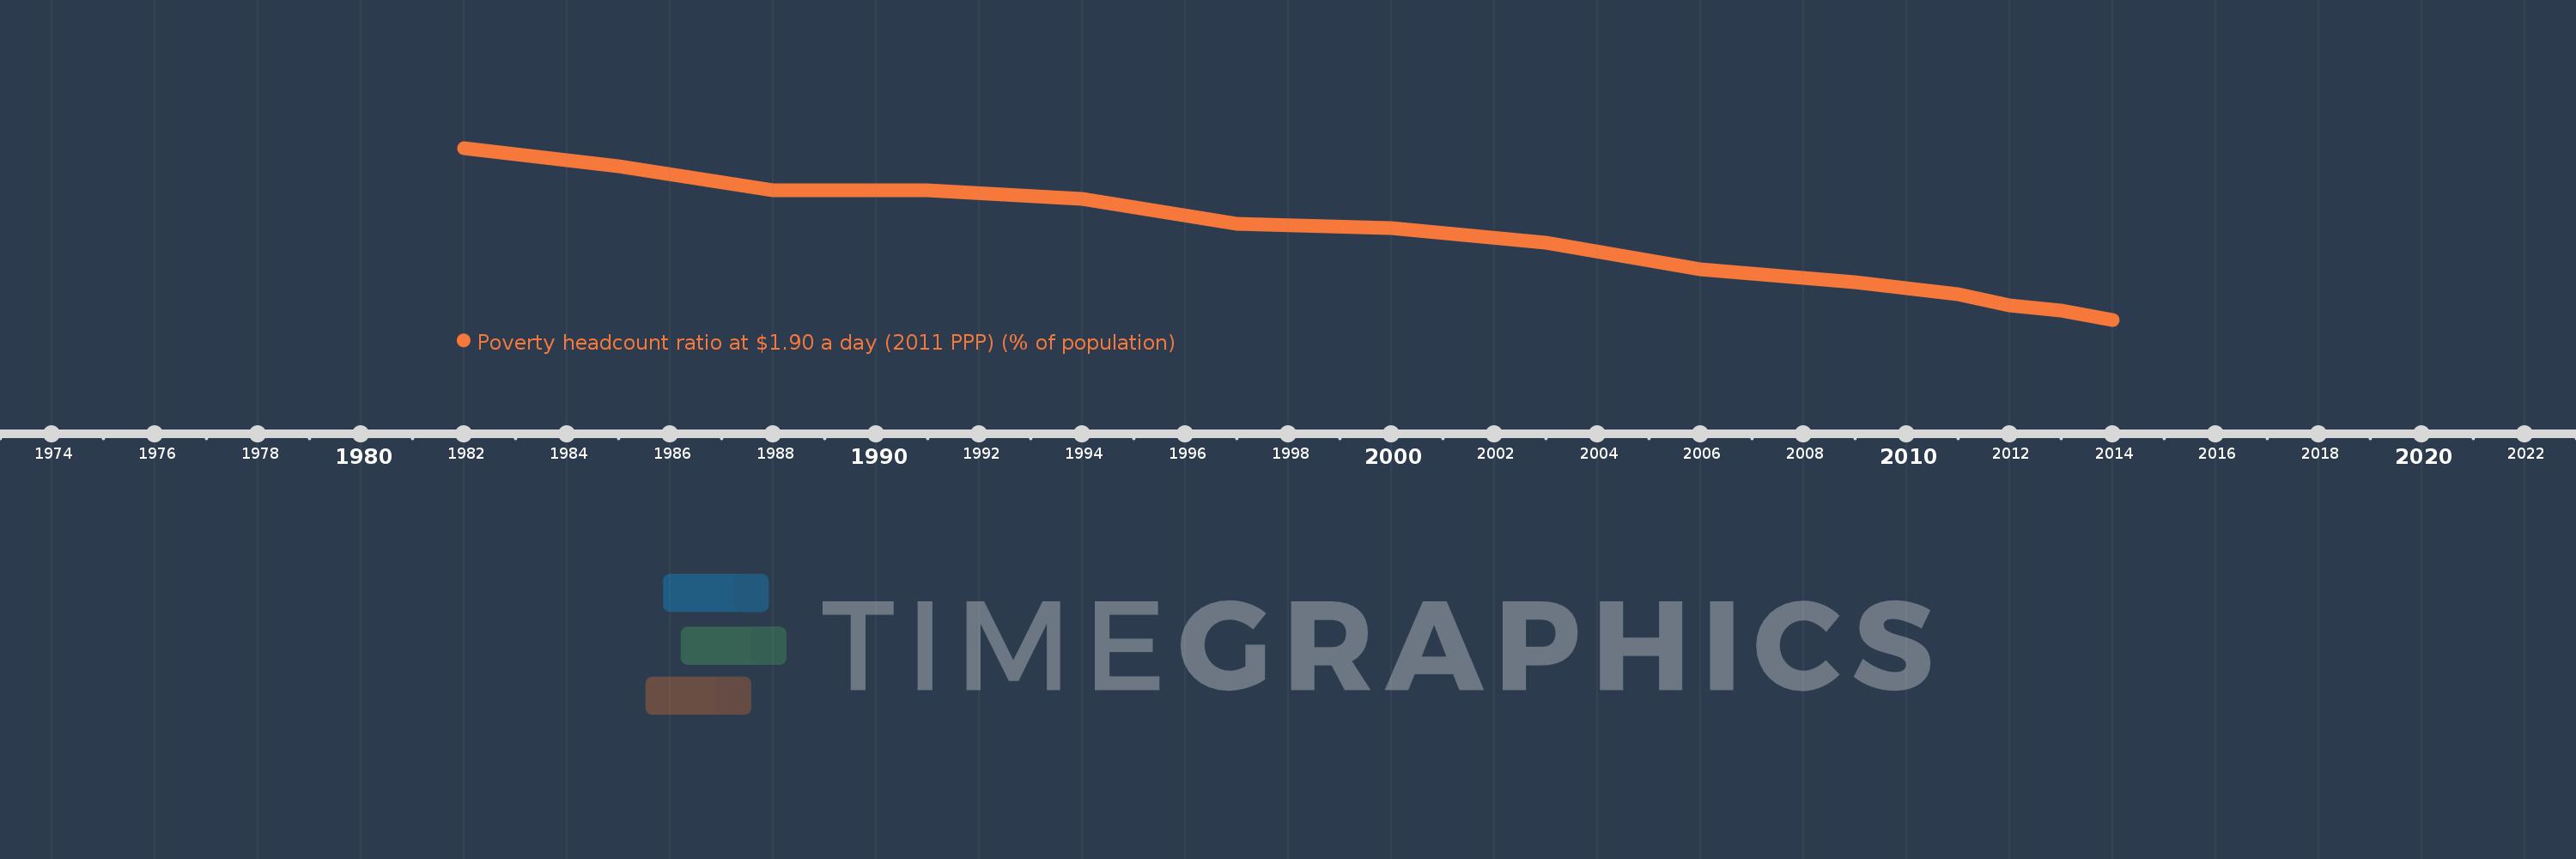
Questa scala temporale mostra un grafico dal 1982 anno al 2014 anno. IDA & IBRD total. I dati fino ad 1981 anno non disponibili. Il numero di osservazioni attuali secondo i date: 14.
La fonte (nome):
Indicatori dello sviluppo mondiale
La fonte (organizzazione):
World Bank, Development Research Group. Data are based on primary household survey data obtained from government statistical agencies and World Bank country departments. Data for high-income economies are from the Luxembourg Income Study database. For more information and methodology, please see PovcalNet (http://iresearch.worldbank.org/PovcalNet/index.htm).
Categorie:
Poverty, Aid Effectiveness, Climate Change
sono stati aggiornati
23 apr 2017 anni
Indicatori delle variazioni dei valori per anni
In media:
30.894
Minima:
12.73
1 gen 2014 anni
Massimo:
52.19
1 gen 1982 anni
Alla data di osservazione
Valore
Variazione assoluta
La variazione rispetto al valore precedente
1 gen 1982 anni
52.19
+52.19
0.0%
1 gen 1985 anni
48.06
-4.13
-7.91%
1 gen 1988 anni
42.53
-5.53
-11.51%
1 gen 1991 anni
42.45
-0.08
-0.19%
1 gen 1994 anni
40.47
-1.98
-4.66%
1 gen 1997 anni
34.73
-5.74
-14.18%
1 gen 2000 anni
33.74
-0.99
-2.85%
1 gen 2003 anni
30.37
-3.37
-9.99%
1 gen 2006 anni
24.41
-5.96
-19.62%
1 gen 2009 anni
21.33
-3.08
-12.62%
1 gen 2011 anni
18.58
-2.75
-12.89%
1 gen 2012 anni
16.12
-2.46
-13.24%
1 gen 2013 anni
14.8
-1.32
-8.19%
1 gen 2014 anni
12.73
-2.07
-13.99%
Classificazione dei paesi secondo i statistiche attuali per anni