Download Queste statistiche in altri paesi:
Linea del tempo:
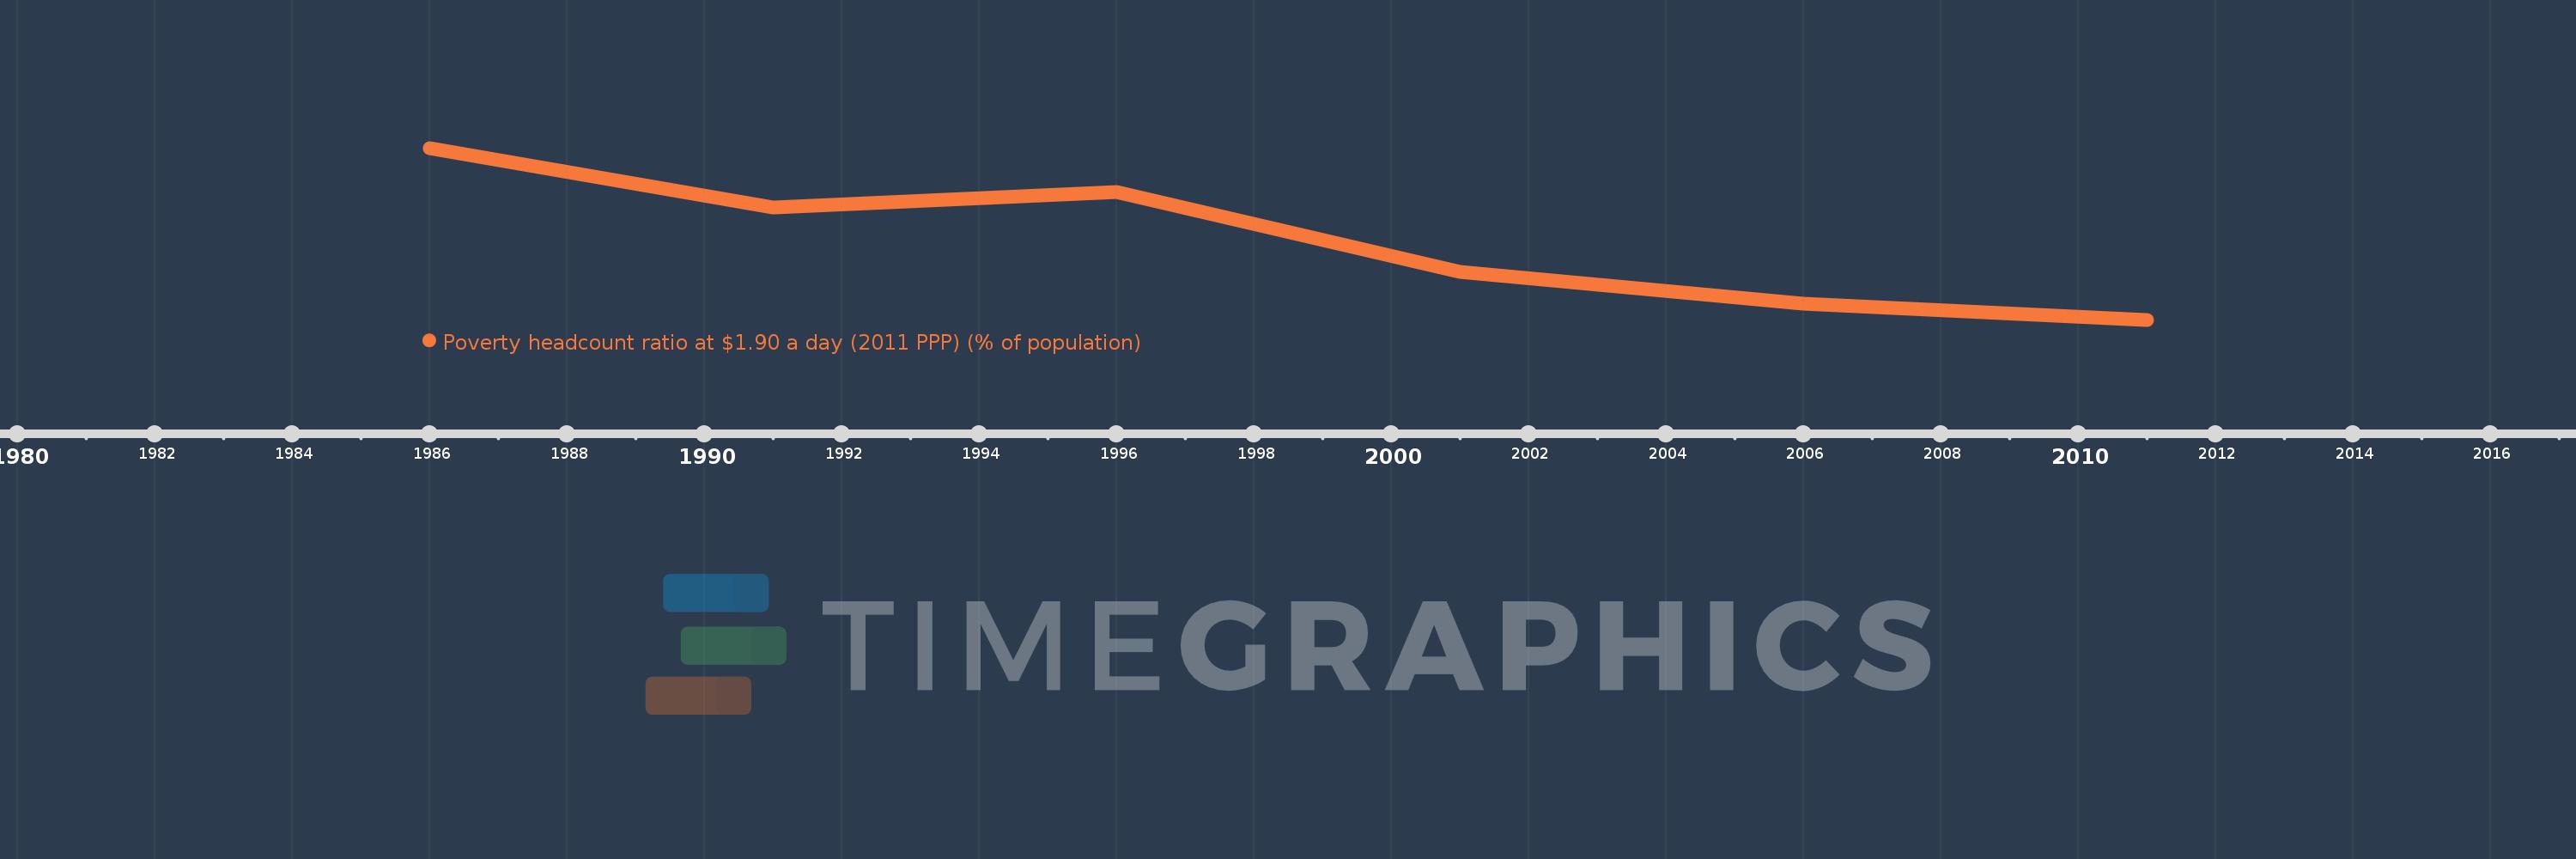
Questa scala temporale mostra un grafico dal 1986 anno al 2011 anno. Tunisia. I dati fino ad 1985 anno non disponibili. Il numero di osservazioni attuali secondo i date: 6.
La fonte (nome):
Indicatori dello sviluppo mondiale
La fonte (organizzazione):
World Bank, Development Research Group. Data are based on primary household survey data obtained from government statistical agencies and World Bank country departments. Data for high-income economies are from the Luxembourg Income Study database. For more information and methodology, please see PovcalNet (http://iresearch.worldbank.org/PovcalNet/index.htm).
Categorie:
Poverty, Aid Effectiveness, Climate Change
sono stati aggiornati
23 apr 2017 anni
Indicatori delle variazioni dei valori per anni
Minima:
1.99
1 gen 2011 anni
Massimo:
13.93
1 gen 1986 anni
Alla data di osservazione
Valore
Variazione assoluta
La variazione rispetto al valore precedente
1 gen 1986 anni
13.93
+13.93
0.0%
1 gen 1991 anni
9.82
-4.11
-29.5%
1 gen 1996 anni
10.86
+1.04
10.59%
1 gen 2001 anni
5.32
-5.54
-51.01%
1 gen 2006 anni
3.09
-2.23
-41.92%
1 gen 2011 anni
1.99
-1.1
-35.6%
Classificazione dei paesi secondo i statistiche attuali per anni