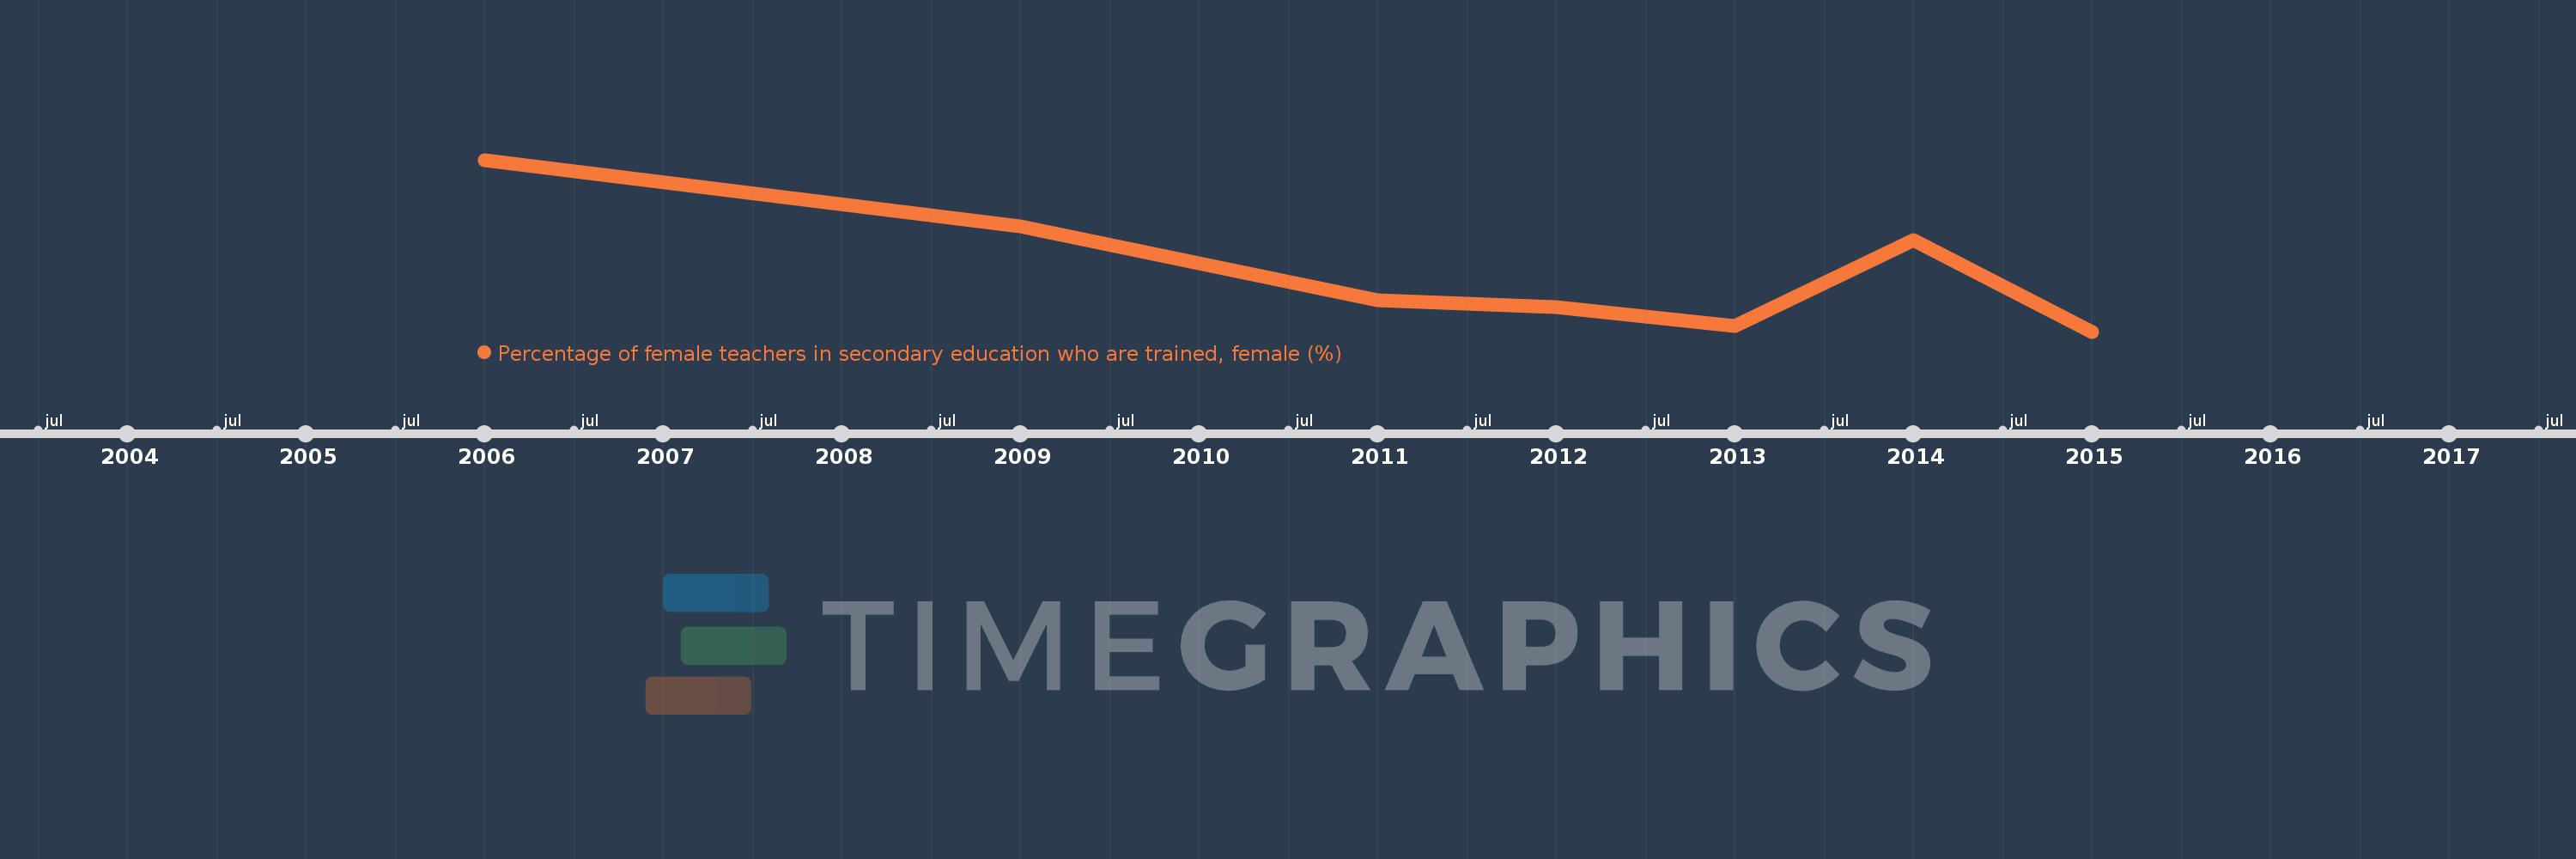
Questa scala temporale mostra un grafico dal 2006 anno al 2015 anno. Pre-demographic dividend. I dati fino ad 2005 anno non disponibili. Il numero di osservazioni attuali secondo i date: 8.
La fonte (nome):
Indicatori dello sviluppo mondiale
La fonte (organizzazione):
UNESCO Institute for Statistics
Categorie:
Education
sono stati aggiornati
23 apr 2017 anni
Indicatori delle variazioni dei valori per anni
In media:
67.289
Minima:
58.159
1 gen 2015 anni
Massimo:
83.345
1 gen 2006 anni
Alla data di osservazione
Valore
Variazione assoluta
La variazione rispetto al valore precedente
1 gen 2006 anni
83.345
+83.345
0.0%
1 gen 2009 anni
73.603
-9.742
-11.69%
1 gen 2010 anni
68.145
-5.458
-7.42%
1 gen 2011 anni
62.725
-5.42
-7.95%
1 gen 2012 anni
61.797
-0.928
-1.48%
1 gen 2013 anni
58.974
-2.823
-4.57%
1 gen 2014 anni
71.564
+12.59
21.35%
1 gen 2015 anni
58.159
-13.405
-18.73%
Classificazione dei paesi secondo i statistiche attuali per anni