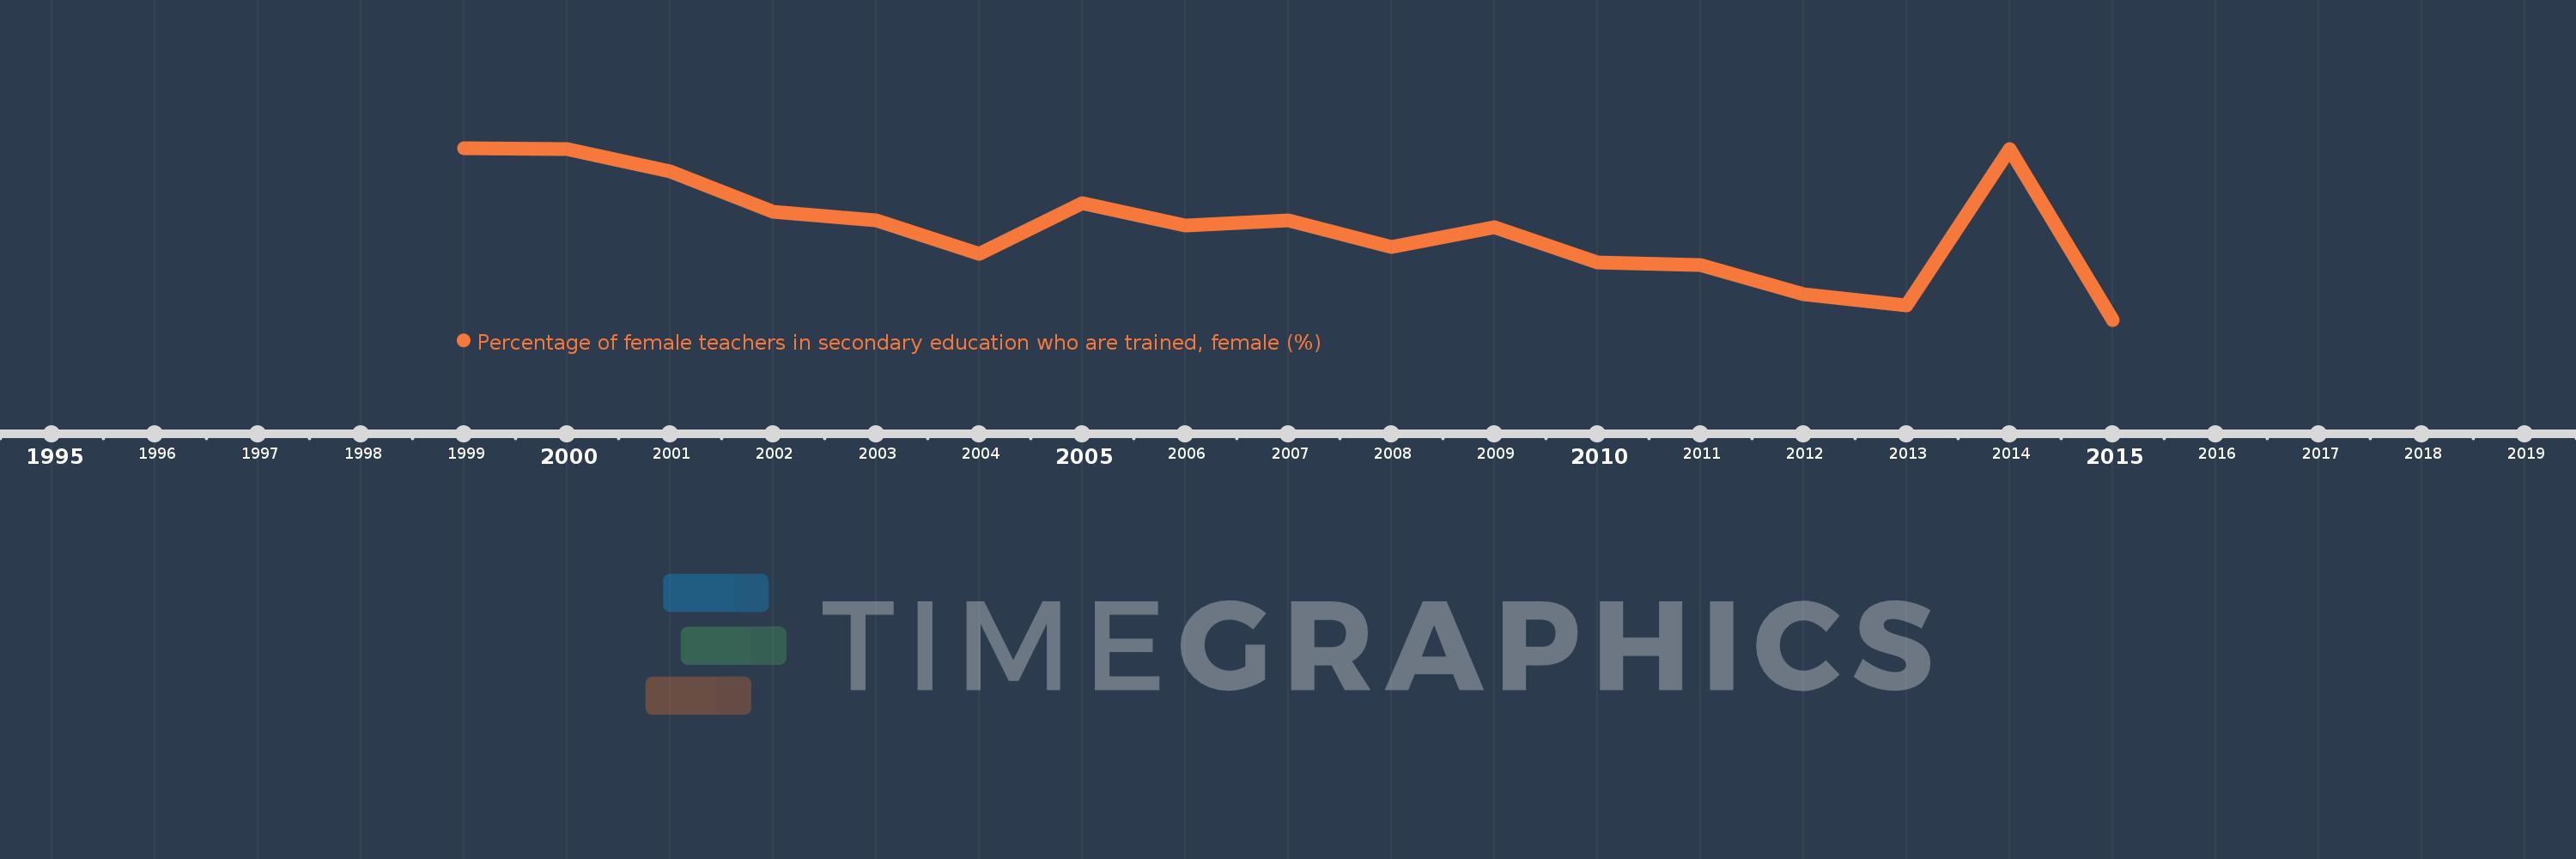
Questa scala temporale mostra un grafico dal 1999 anno al 2015 anno. IDA only. I dati fino ad 1998 anno non disponibili. Il numero di osservazioni attuali secondo i date: 17.
La fonte (nome):
Indicatori dello sviluppo mondiale
La fonte (organizzazione):
UNESCO Institute for Statistics
Categorie:
Education
sono stati aggiornati
23 apr 2017 anni
Indicatori delle variazioni dei valori per anni
In media:
71.575
Minima:
65.727
1 gen 2015 anni
Massimo:
76.671
1 gen 1999 anni
Alla data di osservazione
Valore
Variazione assoluta
La variazione rispetto al valore precedente
1 gen 1999 anni
76.671
+76.671
0.0%
1 gen 2000 anni
76.586
-0.085
-0.11%
1 gen 2001 anni
75.198
-1.388
-1.81%
1 gen 2002 anni
72.613
-2.585
-3.44%
1 gen 2003 anni
72.07
-0.543
-0.75%
1 gen 2004 anni
69.911
-2.159
-3.0%
1 gen 2005 anni
73.133
+3.222
4.61%
1 gen 2006 anni
71.74
-1.394
-1.91%
1 gen 2007 anni
72.034
+0.295
0.41%
1 gen 2008 anni
70.38
-1.655
-2.3%
1 gen 2009 anni
71.6
+1.221
1.73%
1 gen 2010 anni
69.351
-2.25
-3.14%
1 gen 2011 anni
69.194
-0.156
-0.23%
1 gen 2012 anni
67.337
-1.857
-2.68%
1 gen 2013 anni
66.62
-0.717
-1.06%
1 gen 2014 anni
76.604
+9.984
14.99%
1 gen 2015 anni
65.727
-10.877
-14.2%
Classificazione dei paesi secondo i statistiche attuali per anni