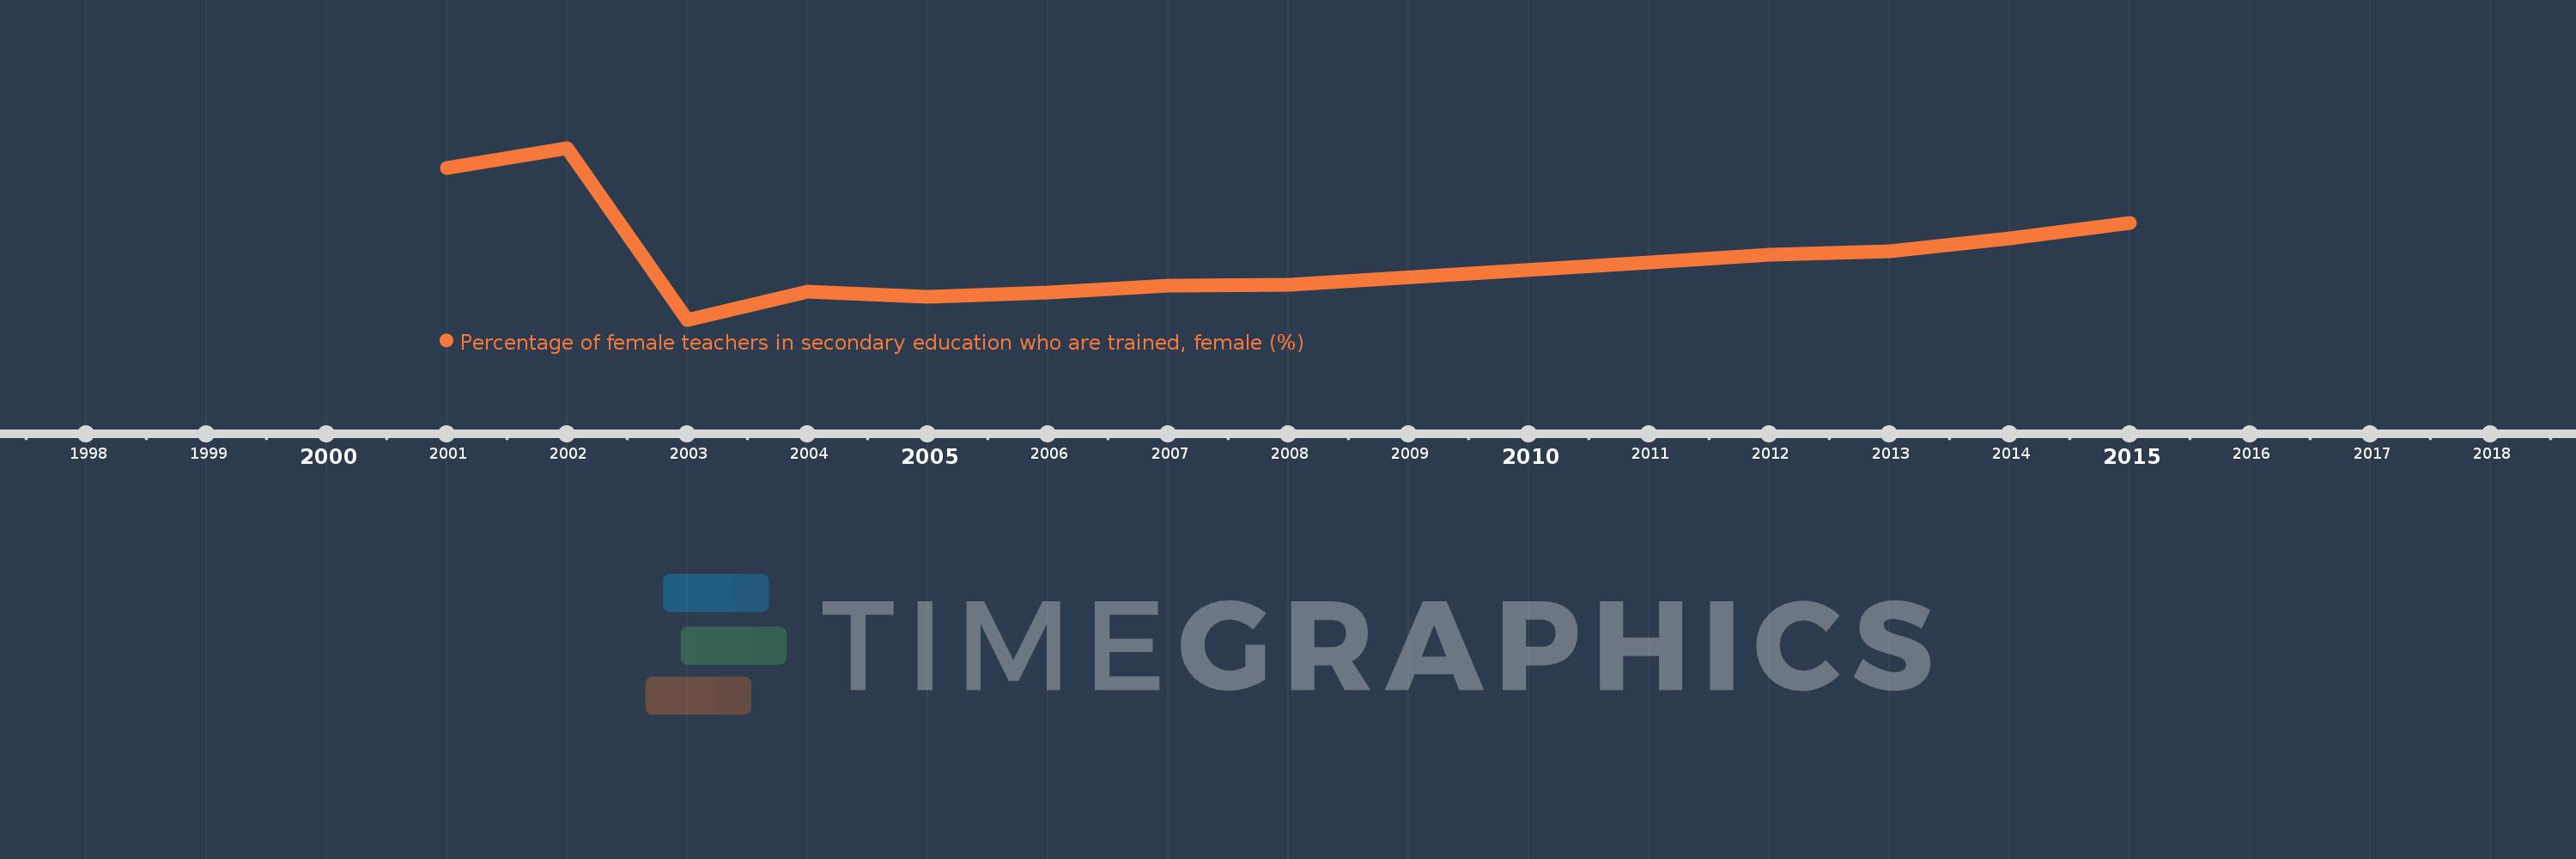
Questa scala temporale mostra un grafico dal 2001 anno al 2015 anno. Ecuador. I dati fino ad 2000 anno non disponibili. Il numero di osservazioni attuali secondo i date: 13.
La fonte (nome):
Indicatori dello sviluppo mondiale
La fonte (organizzazione):
UNESCO Institute for Statistics
Categorie:
Education
sono stati aggiornati
23 apr 2017 anni
Indicatori delle variazioni dei valori per anni
In media:
79.026
Minima:
74.023
1 gen 2003 anni
Massimo:
87.338
1 gen 2002 anni
Alla data di osservazione
Valore
Variazione assoluta
La variazione rispetto al valore precedente
1 gen 2001 anni
85.779
+85.779
0.0%
1 gen 2002 anni
87.338
+1.559
1.82%
1 gen 2003 anni
74.023
-13.315
-15.25%
1 gen 2004 anni
76.223
+2.2
2.97%
1 gen 2005 anni
75.771
-0.452
-0.59%
1 gen 2006 anni
76.148
+0.377
0.5%
1 gen 2007 anni
76.635
+0.488
0.64%
1 gen 2008 anni
76.728
+0.093
0.12%
1 gen 2011 anni
78.431
+1.703
2.22%
1 gen 2012 anni
79.047
+0.616
0.79%
1 gen 2013 anni
79.354
+0.307
0.39%
1 gen 2014 anni
80.313
+0.959
1.21%
1 gen 2015 anni
81.545
+1.232
1.53%
Classificazione dei paesi secondo i statistiche attuali per anni