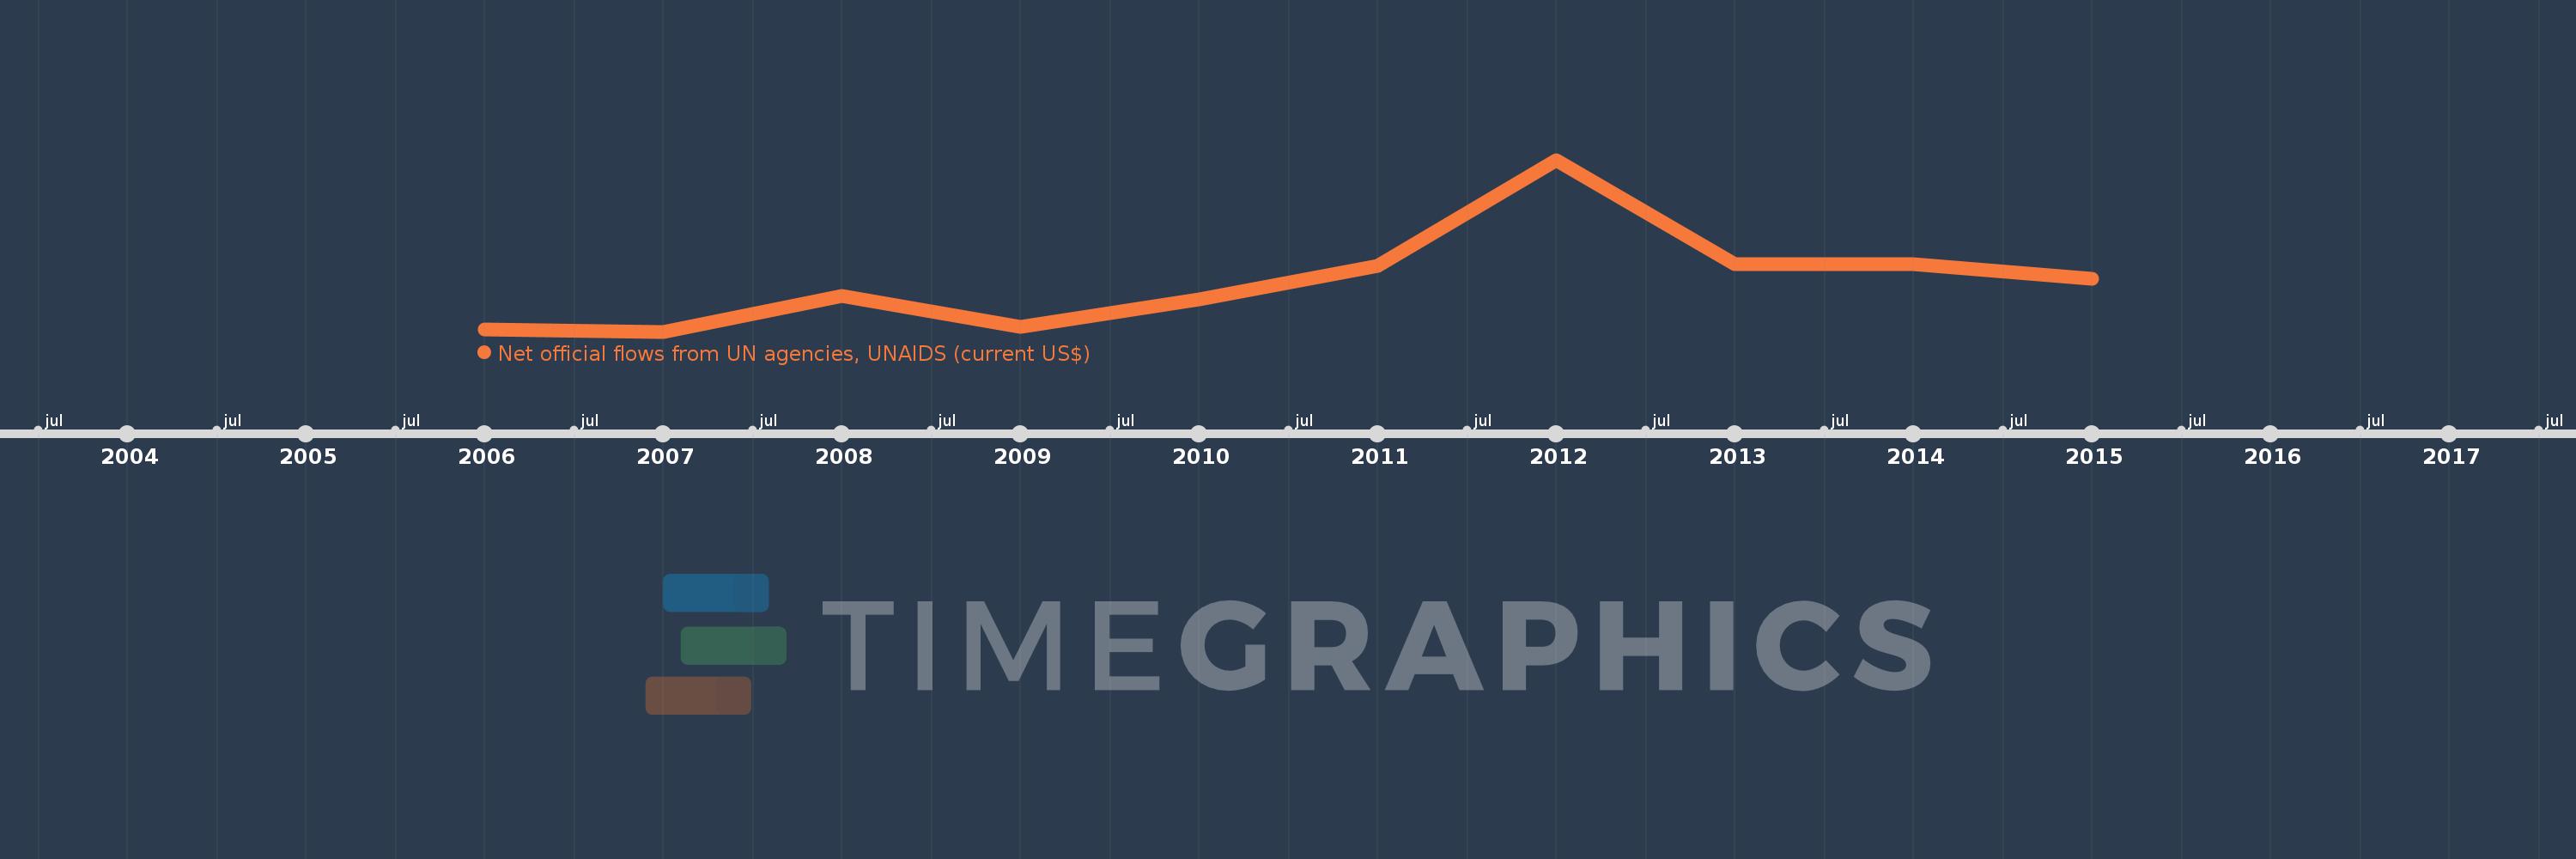
Questa scala temporale mostra un grafico dal 2006 anno al 2015 anno. Middle East & North Africa (excluding high income). I dati fino ad 2005 anno non disponibili. Il numero di osservazioni attuali secondo i date: 10.
La fonte (nome):
Indicatori dello sviluppo mondiale
La fonte (organizzazione):
Development Assistance Committee of the Organisation for Economic Co-operation and Development, Geographical Distribution of Financial Flows to Developing Countries, Development Co-operation Report, and International Development Statistics database. Data are available online at: www.oecd.org/dac/stats/idsonline.
Categorie:
Aid Effectiveness
sono stati aggiornati
23 apr 2017 anni
Indicatori delle variazioni dei valori per anni
In media:
3.446 Mln
Minima:
740.0 Mille.
1 gen 2007 anni
Massimo:
10.04 Mln
1 gen 2012 anni
Alla data di osservazione
Valore
Variazione assoluta
La variazione rispetto al valore precedente
1 gen 2006 anni
840.0 Mille.
+840.0 Mille.
0.0%
1 gen 2007 anni
740.0 Mille.
-100.0 Mille.
-11.9%
1 gen 2008 anni
2.68 Mln
+1.94 Mln
262.16%
1 gen 2009 anni
980.0 Mille.
-1.7 Mln
-63.43%
1 gen 2010 anni
2.47 Mln
+1.49 Mln
152.04%
1 gen 2011 anni
4.32 Mln
+1.85 Mln
74.9%
1 gen 2012 anni
10.04 Mln
+5.72 Mln
132.41%
1 gen 2013 anni
4.39 Mln
-5.65 Mln
-56.27%
1 gen 2014 anni
4.41 Mln
+20.0 Mille.
0.46%
1 gen 2015 anni
3.59 Mln
-820.0 Mille.
-18.59%
Classificazione dei paesi secondo i statistiche attuali per anni