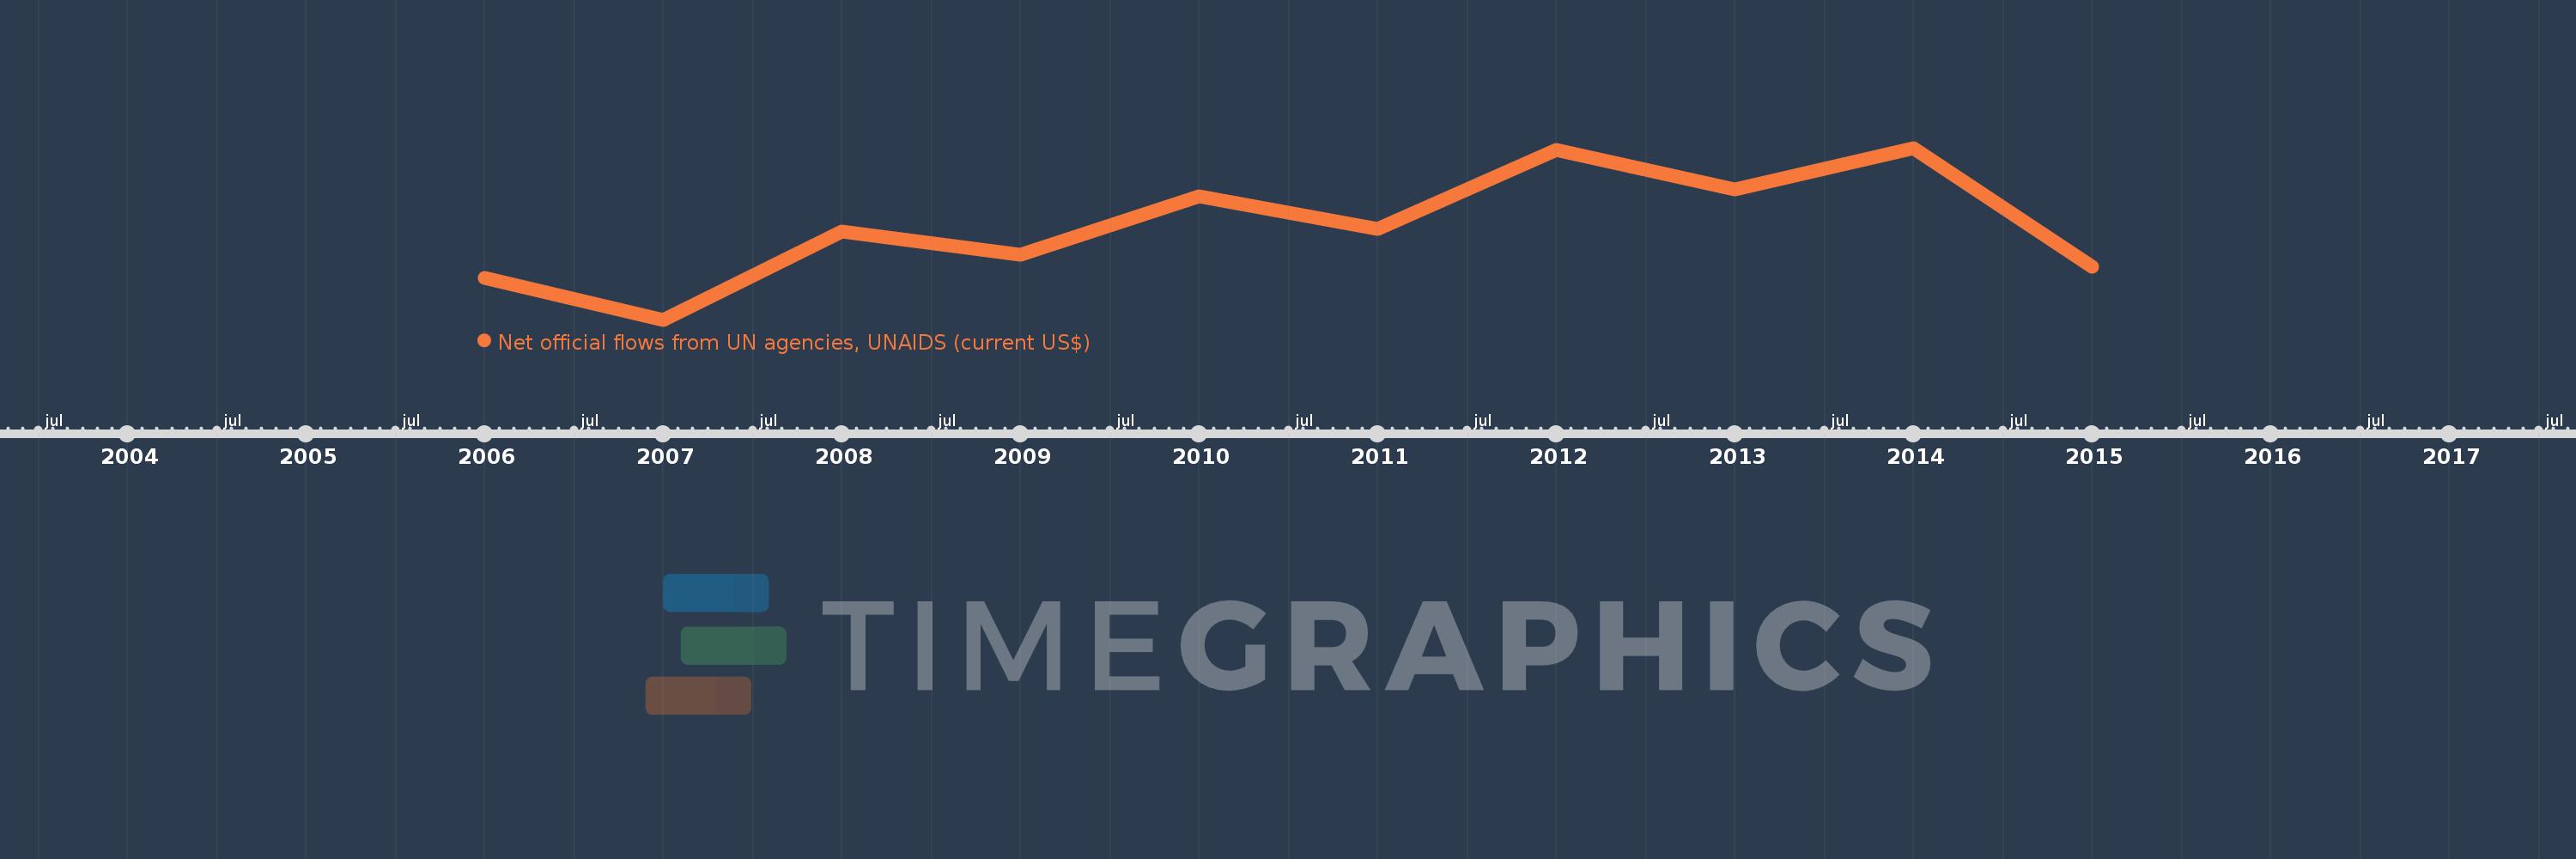
Questa scala temporale mostra un grafico dal 2006 anno al 2015 anno. Lesotho. I dati fino ad 2005 anno non disponibili. Il numero di osservazioni attuali secondo i date: 10.
La fonte (nome):
Indicatori dello sviluppo mondiale
La fonte (organizzazione):
Development Assistance Committee of the Organisation for Economic Co-operation and Development, Geographical Distribution of Financial Flows to Developing Countries, Development Co-operation Report, and International Development Statistics database. Data are available online at: www.oecd.org/dac/stats/idsonline.
Categorie:
Aid Effectiveness
sono stati aggiornati
23 apr 2017 anni
Indicatori delle variazioni dei valori per anni
In media:
732.0 Mille.
Minima:
330.0 Mille.
1 gen 2007 anni
Massimo:
1.07 Mln
1 gen 2014 anni
Alla data di osservazione
Valore
Variazione assoluta
La variazione rispetto al valore precedente
1 gen 2006 anni
510.0 Mille.
+510.0 Mille.
0.0%
1 gen 2007 anni
330.0 Mille.
-180.0 Mille.
-35.29%
1 gen 2008 anni
710.0 Mille.
+380.0 Mille.
115.15%
1 gen 2009 anni
610.0 Mille.
-100.0 Mille.
-14.08%
1 gen 2010 anni
860.0 Mille.
+250.0 Mille.
40.98%
1 gen 2011 anni
720.0 Mille.
-140.0 Mille.
-16.28%
1 gen 2012 anni
1.06 Mln
+340.0 Mille.
47.22%
1 gen 2013 anni
890.0 Mille.
-170.0 Mille.
-16.04%
1 gen 2014 anni
1.07 Mln
+180.0 Mille.
20.22%
1 gen 2015 anni
560.0 Mille.
-510.0 Mille.
-47.66%
Classificazione dei paesi secondo i statistiche attuali per anni