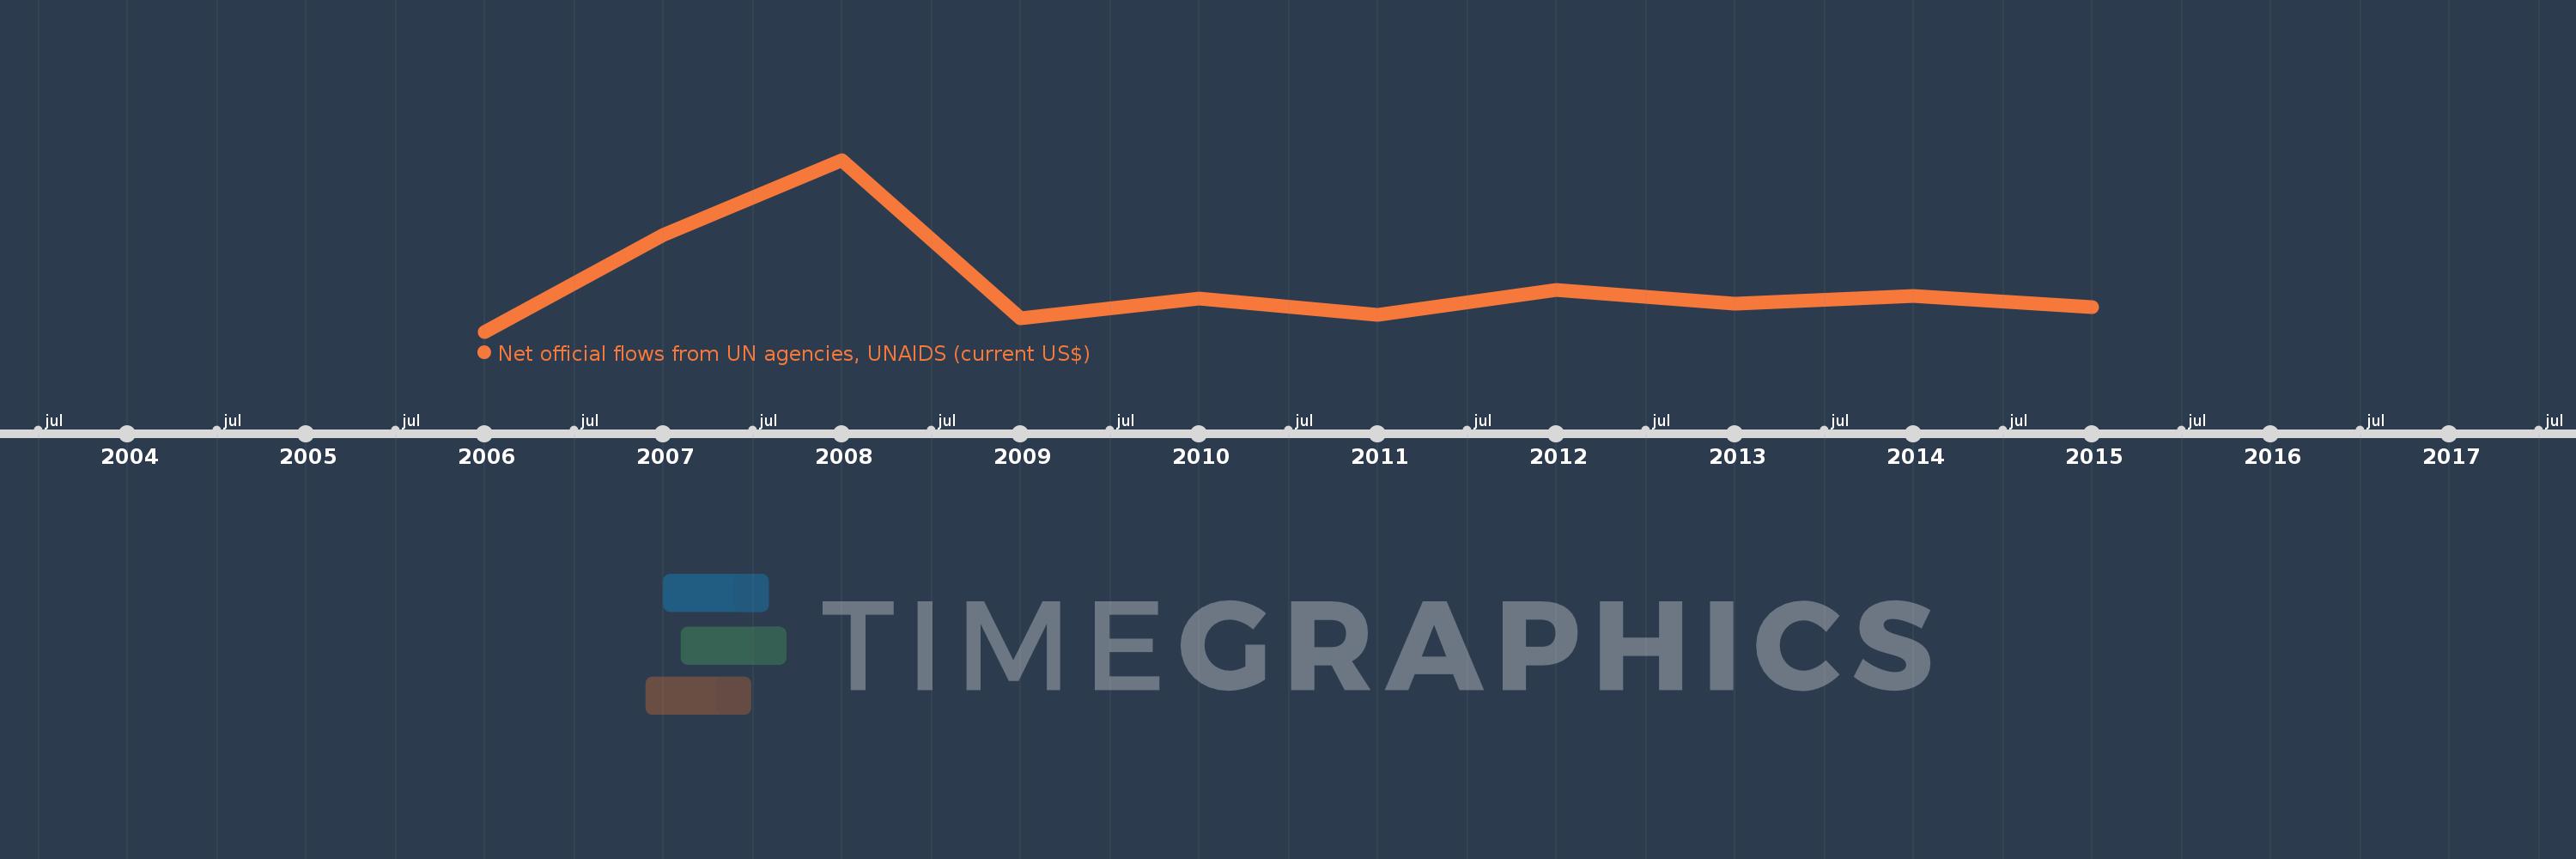
Questa scala temporale mostra un grafico dal 2006 anno al 2015 anno. Thailand. I dati fino ad 2005 anno non disponibili. Il numero di osservazioni attuali secondo i date: 10.
La fonte (nome):
Indicatori dello sviluppo mondiale
La fonte (organizzazione):
Development Assistance Committee of the Organisation for Economic Co-operation and Development, Geographical Distribution of Financial Flows to Developing Countries, Development Co-operation Report, and International Development Statistics database. Data are available online at: www.oecd.org/dac/stats/idsonline.
Categorie:
Aid Effectiveness
sono stati aggiornati
23 apr 2017 anni
Indicatori delle variazioni dei valori per anni
In media:
1.162 Mln
Minima:
460.0 Mille.
1 gen 2006 anni
Massimo:
3.08 Mln
1 gen 2008 anni
Alla data di osservazione
Valore
Variazione assoluta
La variazione rispetto al valore precedente
1 gen 2006 anni
460.0 Mille.
+460.0 Mille.
0.0%
1 gen 2007 anni
1.93 Mln
+1.47 Mln
319.57%
1 gen 2008 anni
3.08 Mln
+1.15 Mln
59.59%
1 gen 2009 anni
660.0 Mille.
-2.42 Mln
-78.57%
1 gen 2010 anni
970.0 Mille.
+310.0 Mille.
46.97%
1 gen 2011 anni
710.0 Mille.
-260.0 Mille.
-26.8%
1 gen 2012 anni
1.09 Mln
+380.0 Mille.
53.52%
1 gen 2013 anni
890.0 Mille.
-200.0 Mille.
-18.35%
1 gen 2014 anni
1000.0 Mille.
+110.0 Mille.
12.36%
1 gen 2015 anni
830.0 Mille.
-170.0 Mille.
-17.0%
Classificazione dei paesi secondo i statistiche attuali per anni