33
/it/
AIzaSyAYiBZKx7MnpbEhh9jyipgxe19OcubqV5w
August 1, 2025
44214
Least developed countries: UN classification
LDC
false
2
1
Fertilizer consumption (% of fertilizer production)
2015,2014,2013,2012,2011,2010,2009,2008,2007,2006,2005,2004,2003
Download
Biblioteca di statistiche globali →Least developed countries: UN classification →

Fertilizer consumption (% of fertilizer production)

Queste statistiche in altri paesi:

AfghanistanAlgeriaArab WorldArgentinaArmeniaAustraliaBahrainBangladeshBelarusBelgiumBosnia and HerzegovinaBrazilBulgariaCanadaCaribbean small statesCentral Europe and the BalticsChileChinaColombiaCroatiaCubaCzech RepublicDenmarkEarly-demographic dividendEast Asia & PacificEast Asia & Pacific (excluding high income)East Asia & Pacific (IDA & IBRD countries)Egypt, Arab Rep.EstoniaEuro areaEurope & Central AsiaEurope & Central Asia (excluding high income)Europe & Central Asia (IDA & IBRD countries)European UnionFinlandFragile and conflict affected situationsFranceGeorgiaGermanyGreeceHeavily indebted poor countries (HIPC)High incomeHungaryIBRD onlyIDA & IBRD totalIDA blendIDA onlyIDA totalIndiaIndonesiaIran, Islamic Rep.IraqIrelandIsraelItalyJapanJordanKazakhstanKorea, Rep.KuwaitLate-demographic dividendLatin America & Caribbean Latin America & Caribbean (excluding high income)Latin America & the Caribbean (IDA & IBRD countries)Least developed countries: UN classificationLebanonLibyaLithuaniaLow & middle incomeLow incomeLower middle incomeMalawiMalaysiaMaliMauritiusMexicoMiddle East & North AfricaMiddle East & North Africa (excluding high income)Middle East & North Africa (IDA & IBRD countries)Middle incomeMoroccoMyanmarNetherlandsNew ZealandNigeriaNorth AmericaNorwayOECD membersOmanOther small statesPakistanPeruPhilippinesPolandPortugalPost-demographic dividendPre-demographic dividendQatarRomaniaRussian FederationSaudi ArabiaSenegalSerbiaSlovak RepublicSloveniaSmall statesSouth AfricaSouth AsiaSouth Asia (IDA & IBRD)SpainSri LankaSub-Saharan Africa Sub-Saharan Africa (excluding high income)Sub-Saharan Africa (IDA & IBRD countries)SwedenSyrian Arab RepublicTajikistanThailandTrinidad and TobagoTunisiaTurkeyUkraineUnited Arab EmiratesUnited KingdomUnited StatesUpper middle incomeUruguayUzbekistanVenezuela, RBVietnamWorldZimbabwe

Linea del tempo:

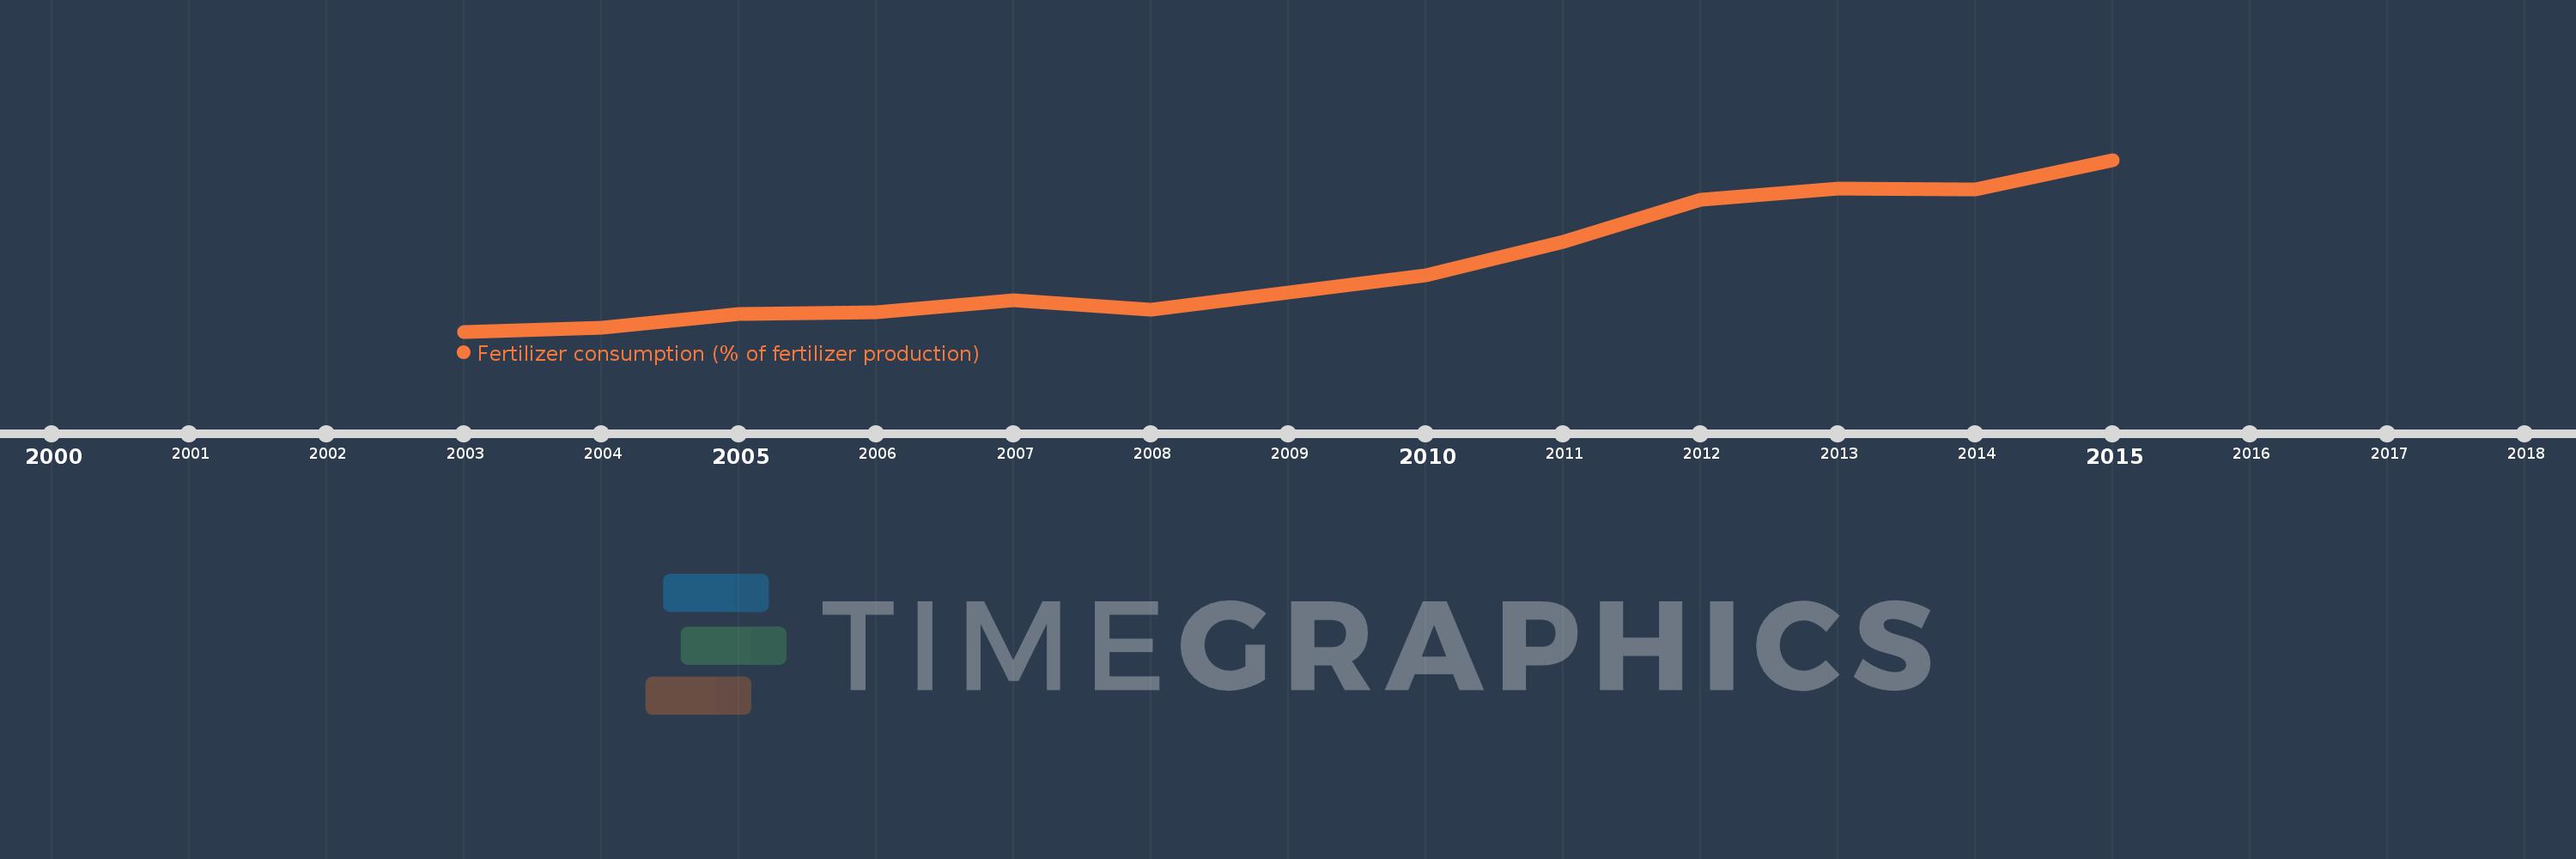
Questa scala temporale mostra un grafico dal 2003 anno al 2015 anno. Least developed countries: UN classification. I dati fino ad 2002 anno non disponibili. Il numero di osservazioni attuali secondo i date: 13.

La fonte (nome):

Indicatori dello sviluppo mondiale

La fonte (organizzazione):

Food and Agriculture Organization, electronic files and web site.

Categorie:

Agriculture & Rural Development

sono stati aggiornati

23 apr 2017 anni

Indicatori delle variazioni dei valori per anni

In media:
280.644
Minima:
127.997
1 gen 2003 anni
Massimo:
520.173
1 gen 2015 anni
Alla data di osservazione
Valore
Variazione assoluta
La variazione rispetto al valore precedente
1 gen 2003 anni
127.997
+127.997
0.0%
1 gen 2004 anni
137.495
+9.498
7.42%
1 gen 2005 anni
169.038
+31.543
22.94%
1 gen 2006 anni
172.255
+3.217
1.9%
1 gen 2007 anni
199.253
+26.998
15.67%
1 gen 2008 anni
177.872
-21.382
-10.73%
1 gen 2009 anni
218.12
+40.248
22.63%
1 gen 2010 anni
257.18
+39.061
17.91%
1 gen 2011 anni
332.497
+75.317
29.29%
1 gen 2012 anni
429.648
+97.151
29.22%
1 gen 2013 anni
454.626
+24.978
5.81%
1 gen 2014 anni
452.215
-2.411
-0.53%
1 gen 2015 anni
520.173
+67.958
15.03%

Classificazione dei paesi secondo i statistiche attuali per anni