33
/it/
AIzaSyAYiBZKx7MnpbEhh9jyipgxe19OcubqV5w
August 1, 2025
216375
Pakistan
PAK
true
2
1
Fertilizer consumption (% of fertilizer production)
2015,2014,2013,2012,2011,2010,2009,2008,2007,2006,2005,2004,2003
Download
Biblioteca di statistiche globali →Pakistan →

Fertilizer consumption (% of fertilizer production)

Queste statistiche in altri paesi:

AfghanistanAlgeriaArab WorldArgentinaArmeniaAustraliaBahrainBangladeshBelarusBelgiumBosnia and HerzegovinaBrazilBulgariaCanadaCaribbean small statesCentral Europe and the BalticsChileChinaColombiaCroatiaCubaCzech RepublicDenmarkEarly-demographic dividendEast Asia & PacificEast Asia & Pacific (excluding high income)East Asia & Pacific (IDA & IBRD countries)Egypt, Arab Rep.EstoniaEuro areaEurope & Central AsiaEurope & Central Asia (excluding high income)Europe & Central Asia (IDA & IBRD countries)European UnionFinlandFragile and conflict affected situationsFranceGeorgiaGermanyGreeceHeavily indebted poor countries (HIPC)High incomeHungaryIBRD onlyIDA & IBRD totalIDA blendIDA onlyIDA totalIndiaIndonesiaIran, Islamic Rep.IraqIrelandIsraelItalyJapanJordanKazakhstanKorea, Rep.KuwaitLate-demographic dividendLatin America & Caribbean Latin America & Caribbean (excluding high income)Latin America & the Caribbean (IDA & IBRD countries)Least developed countries: UN classificationLebanonLibyaLithuaniaLow & middle incomeLow incomeLower middle incomeMalawiMalaysiaMaliMauritiusMexicoMiddle East & North AfricaMiddle East & North Africa (excluding high income)Middle East & North Africa (IDA & IBRD countries)Middle incomeMoroccoMyanmarNetherlandsNew ZealandNigeriaNorth AmericaNorwayOECD membersOmanOther small statesPakistanPeruPhilippinesPolandPortugalPost-demographic dividendPre-demographic dividendQatarRomaniaRussian FederationSaudi ArabiaSenegalSerbiaSlovak RepublicSloveniaSmall statesSouth AfricaSouth AsiaSouth Asia (IDA & IBRD)SpainSri LankaSub-Saharan Africa Sub-Saharan Africa (excluding high income)Sub-Saharan Africa (IDA & IBRD countries)SwedenSyrian Arab RepublicTajikistanThailandTrinidad and TobagoTunisiaTurkeyUkraineUnited Arab EmiratesUnited KingdomUnited StatesUpper middle incomeUruguayUzbekistanVenezuela, RBVietnamWorldZimbabwe

Linea del tempo:

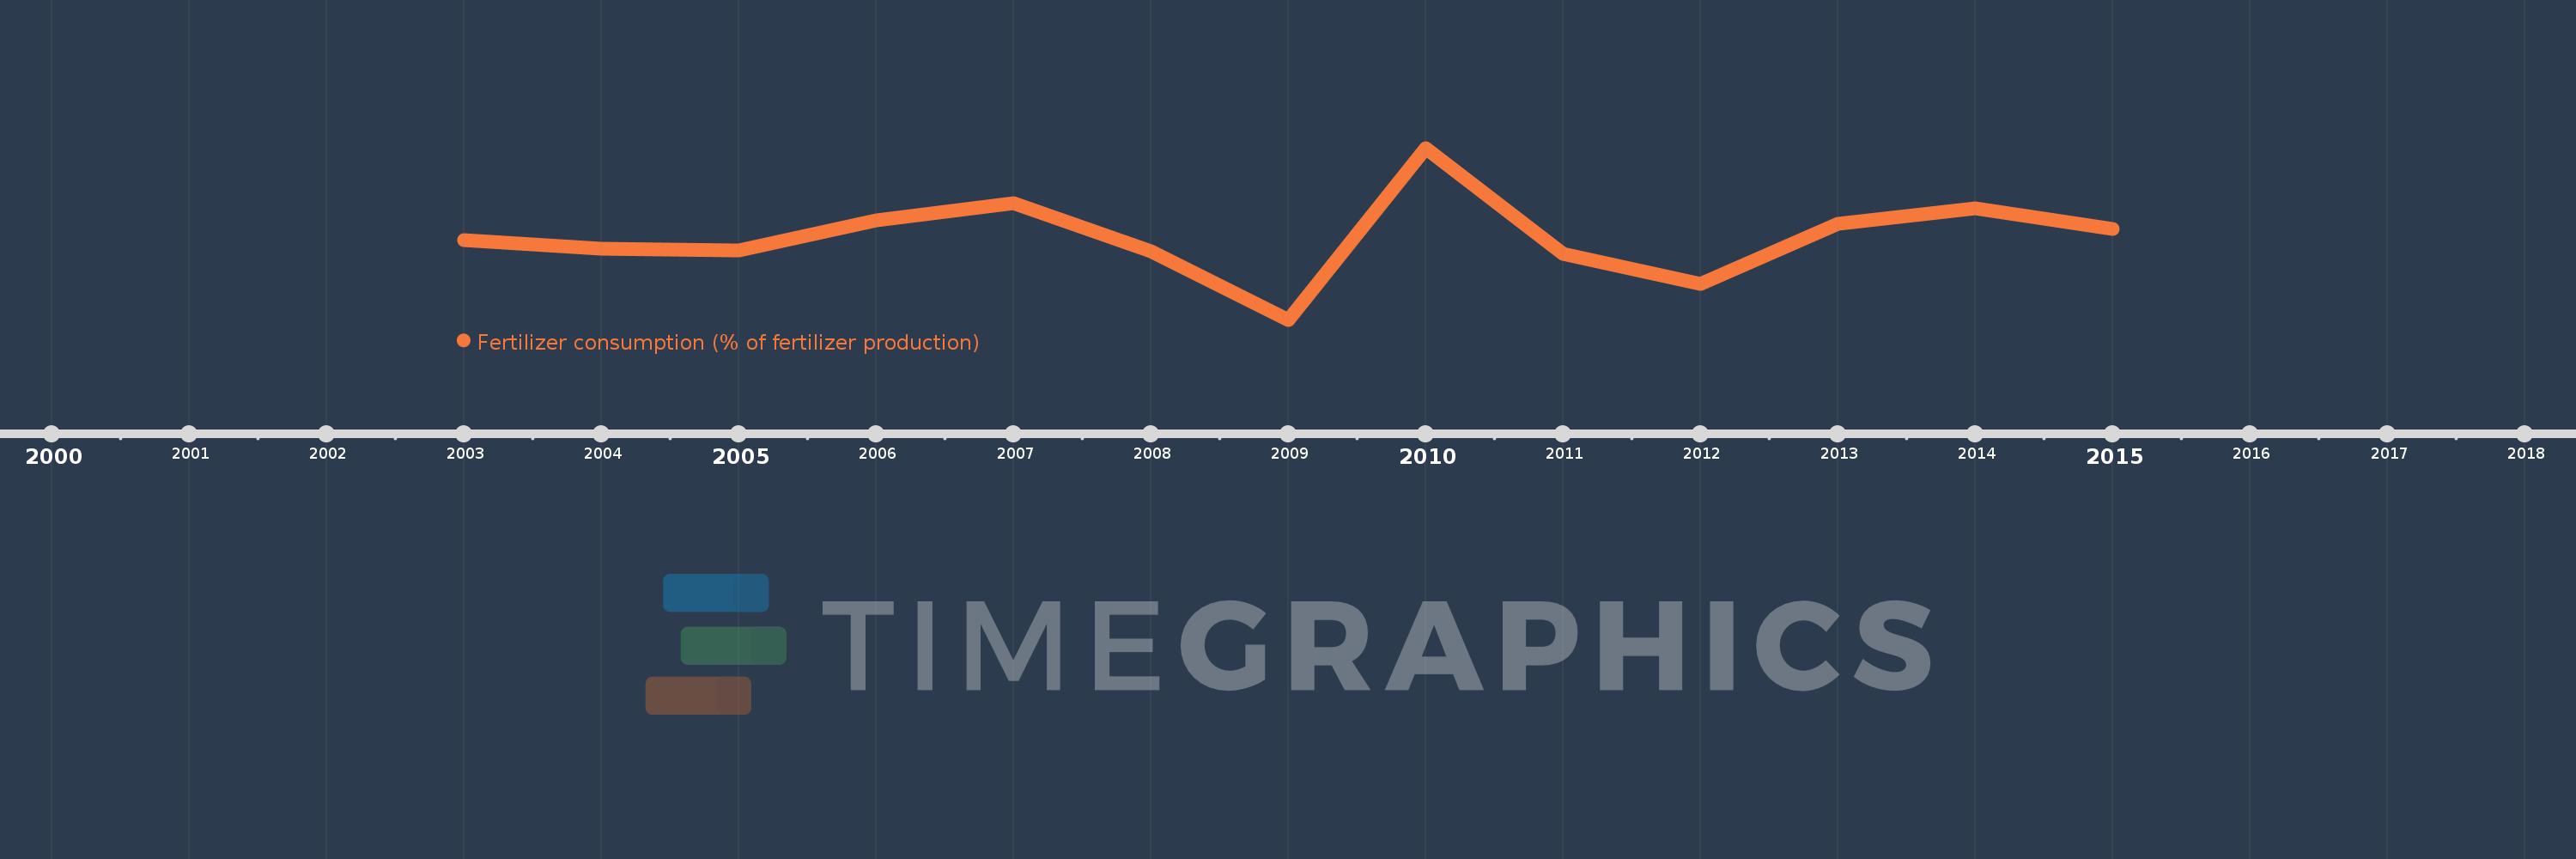
Questa scala temporale mostra un grafico dal 2003 anno al 2015 anno. Pakistan. I dati fino ad 2002 anno non disponibili. Il numero di osservazioni attuali secondo i date: 13.

La fonte (nome):

Indicatori dello sviluppo mondiale

La fonte (organizzazione):

Food and Agriculture Organization, electronic files and web site.

Categorie:

Agriculture & Rural Development

sono stati aggiornati

23 apr 2017 anni

Indicatori delle variazioni dei valori per anni

In media:
132.477
Minima:
122.081
1 gen 2009 anni
Massimo:
143.661
1 gen 2010 anni
Alla data di osservazione
Valore
Variazione assoluta
La variazione rispetto al valore precedente
1 gen 2003 anni
132.134
+132.134
0.0%
1 gen 2004 anni
131.01
-1.124
-0.85%
1 gen 2005 anni
130.735
-0.275
-0.21%
1 gen 2006 anni
134.557
+3.822
2.92%
1 gen 2007 anni
136.72
+2.164
1.61%
1 gen 2008 anni
130.676
-6.045
-4.42%
1 gen 2009 anni
122.081
-8.595
-6.58%
1 gen 2010 anni
143.661
+21.58
17.68%
1 gen 2011 anni
130.351
-13.309
-9.26%
1 gen 2012 anni
126.627
-3.724
-2.86%
1 gen 2013 anni
134.109
+7.482
5.91%
1 gen 2014 anni
136.03
+1.921
1.43%
1 gen 2015 anni
133.513
-2.517
-1.85%

Classificazione dei paesi secondo i statistiche attuali per anni