33
/it/
AIzaSyAYiBZKx7MnpbEhh9jyipgxe19OcubqV5w
August 1, 2025
35700
High income
HIC
false
2
1
Fertilizer consumption (% of fertilizer production)
2015,2014,2013,2012,2011,2010,2009,2008,2007,2006,2005,2004,2003
Download
Biblioteca di statistiche globali →High income →

Fertilizer consumption (% of fertilizer production)

Queste statistiche in altri paesi:

AfghanistanAlgeriaArab WorldArgentinaArmeniaAustraliaBahrainBangladeshBelarusBelgiumBosnia and HerzegovinaBrazilBulgariaCanadaCaribbean small statesCentral Europe and the BalticsChileChinaColombiaCroatiaCubaCzech RepublicDenmarkEarly-demographic dividendEast Asia & PacificEast Asia & Pacific (excluding high income)East Asia & Pacific (IDA & IBRD countries)Egypt, Arab Rep.EstoniaEuro areaEurope & Central AsiaEurope & Central Asia (excluding high income)Europe & Central Asia (IDA & IBRD countries)European UnionFinlandFragile and conflict affected situationsFranceGeorgiaGermanyGreeceHeavily indebted poor countries (HIPC)High incomeHungaryIBRD onlyIDA & IBRD totalIDA blendIDA onlyIDA totalIndiaIndonesiaIran, Islamic Rep.IraqIrelandIsraelItalyJapanJordanKazakhstanKorea, Rep.KuwaitLate-demographic dividendLatin America & Caribbean Latin America & Caribbean (excluding high income)Latin America & the Caribbean (IDA & IBRD countries)Least developed countries: UN classificationLebanonLibyaLithuaniaLow & middle incomeLow incomeLower middle incomeMalawiMalaysiaMaliMauritiusMexicoMiddle East & North AfricaMiddle East & North Africa (excluding high income)Middle East & North Africa (IDA & IBRD countries)Middle incomeMoroccoMyanmarNetherlandsNew ZealandNigeriaNorth AmericaNorwayOECD membersOmanOther small statesPakistanPeruPhilippinesPolandPortugalPost-demographic dividendPre-demographic dividendQatarRomaniaRussian FederationSaudi ArabiaSenegalSerbiaSlovak RepublicSloveniaSmall statesSouth AfricaSouth AsiaSouth Asia (IDA & IBRD)SpainSri LankaSub-Saharan Africa Sub-Saharan Africa (excluding high income)Sub-Saharan Africa (IDA & IBRD countries)SwedenSyrian Arab RepublicTajikistanThailandTrinidad and TobagoTunisiaTurkeyUkraineUnited Arab EmiratesUnited KingdomUnited StatesUpper middle incomeUruguayUzbekistanVenezuela, RBVietnamWorldZimbabwe

Linea del tempo:

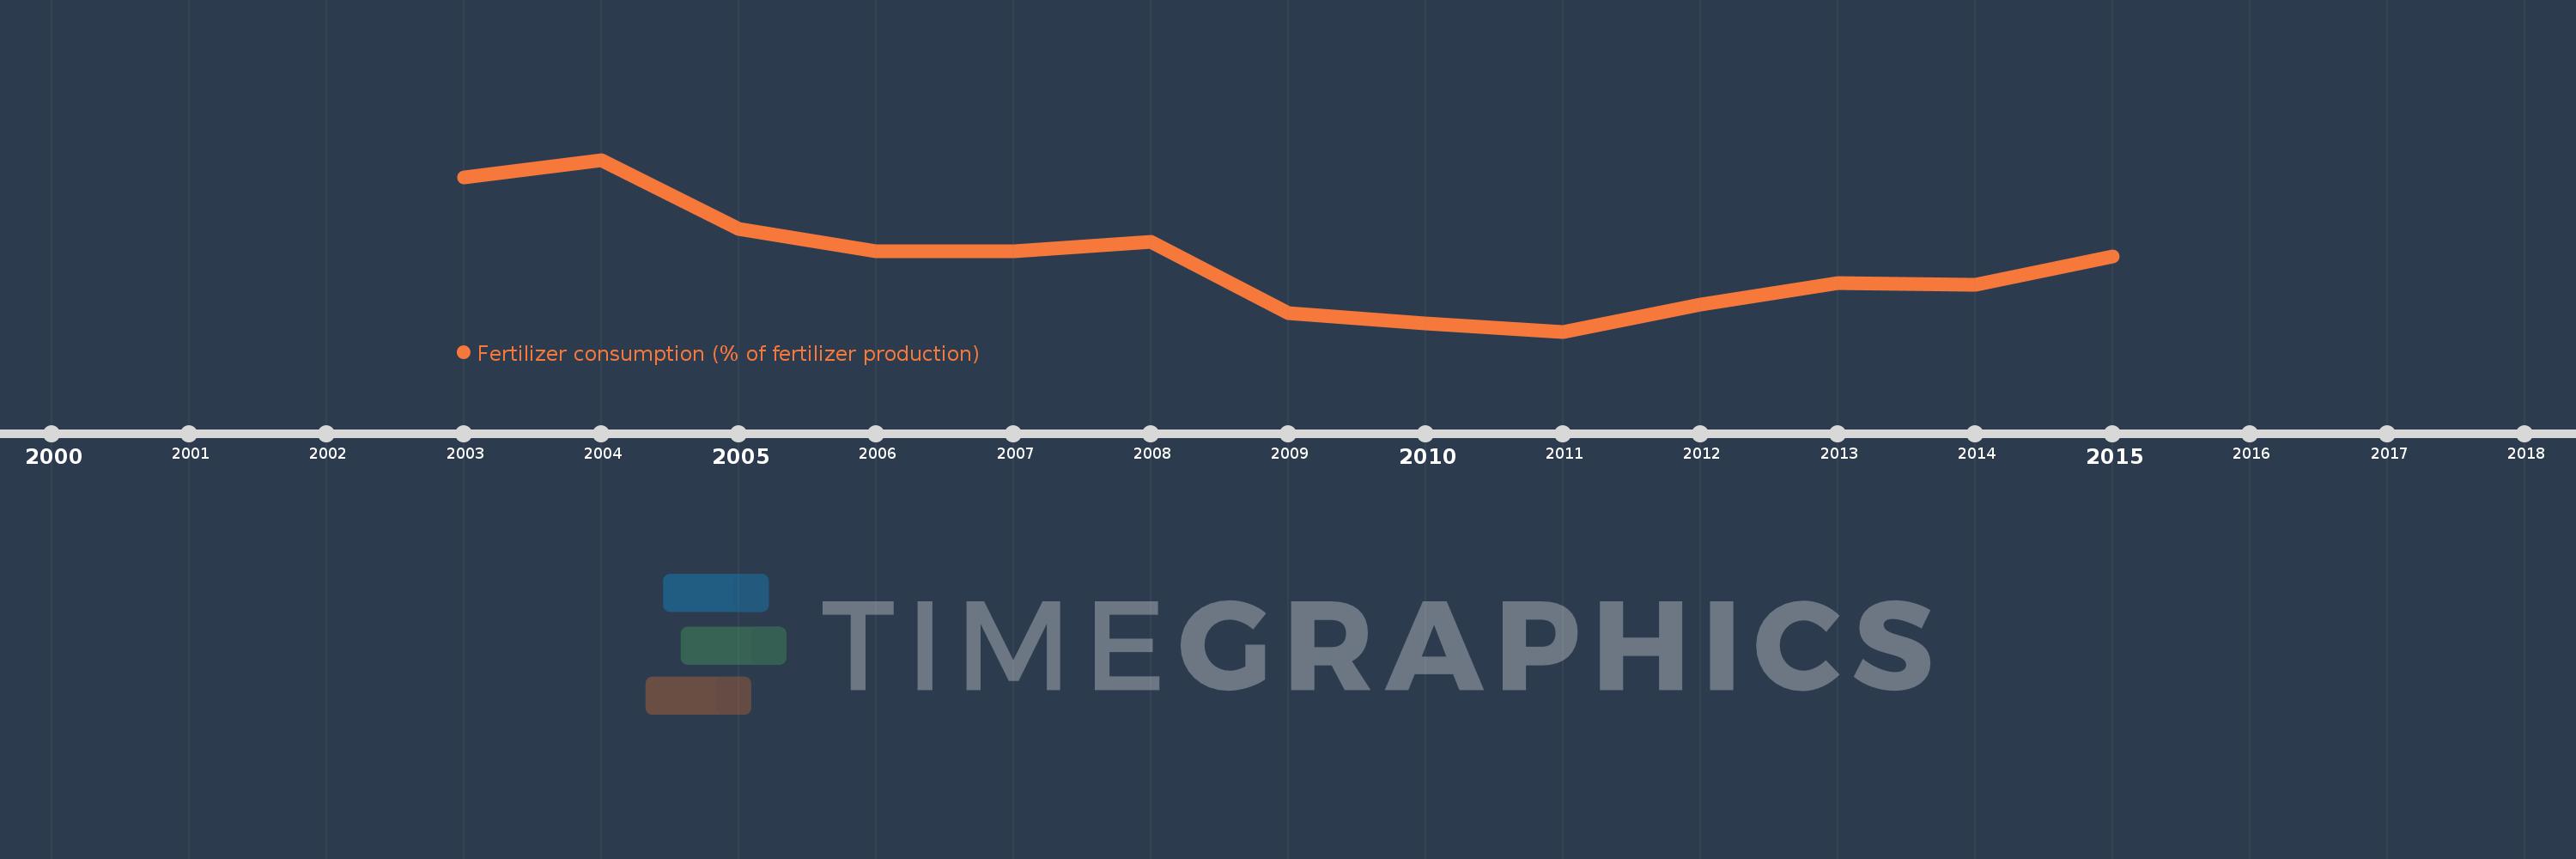
Questa scala temporale mostra un grafico dal 2003 anno al 2015 anno. High income. I dati fino ad 2002 anno non disponibili. Il numero di osservazioni attuali secondo i date: 13.

La fonte (nome):

Indicatori dello sviluppo mondiale

La fonte (organizzazione):

Food and Agriculture Organization, electronic files and web site.

Categorie:

Agriculture & Rural Development

sono stati aggiornati

23 apr 2017 anni

Indicatori delle variazioni dei valori per anni

In media:
71.869
Minima:
65.563
1 gen 2011 anni
Massimo:
81.148
1 gen 2004 anni
Alla data di osservazione
Valore
Variazione assoluta
La variazione rispetto al valore precedente
1 gen 2003 anni
79.56
+79.56
0.0%
1 gen 2004 anni
81.148
+1.588
2.0%
1 gen 2005 anni
74.84
-6.308
-7.77%
1 gen 2006 anni
72.867
-1.972
-2.64%
1 gen 2007 anni
72.82
-0.047
-0.06%
1 gen 2008 anni
73.745
+0.925
1.27%
1 gen 2009 anni
67.234
-6.512
-8.83%
1 gen 2010 anni
66.276
-0.958
-1.42%
1 gen 2011 anni
65.563
-0.713
-1.08%
1 gen 2012 anni
68.016
+2.453
3.74%
1 gen 2013 anni
70.001
+1.985
2.92%
1 gen 2014 anni
69.826
-0.175
-0.25%
1 gen 2015 anni
72.407
+2.581
3.7%

Classificazione dei paesi secondo i statistiche attuali per anni