Download Queste statistiche in altri paesi:
Linea del tempo:
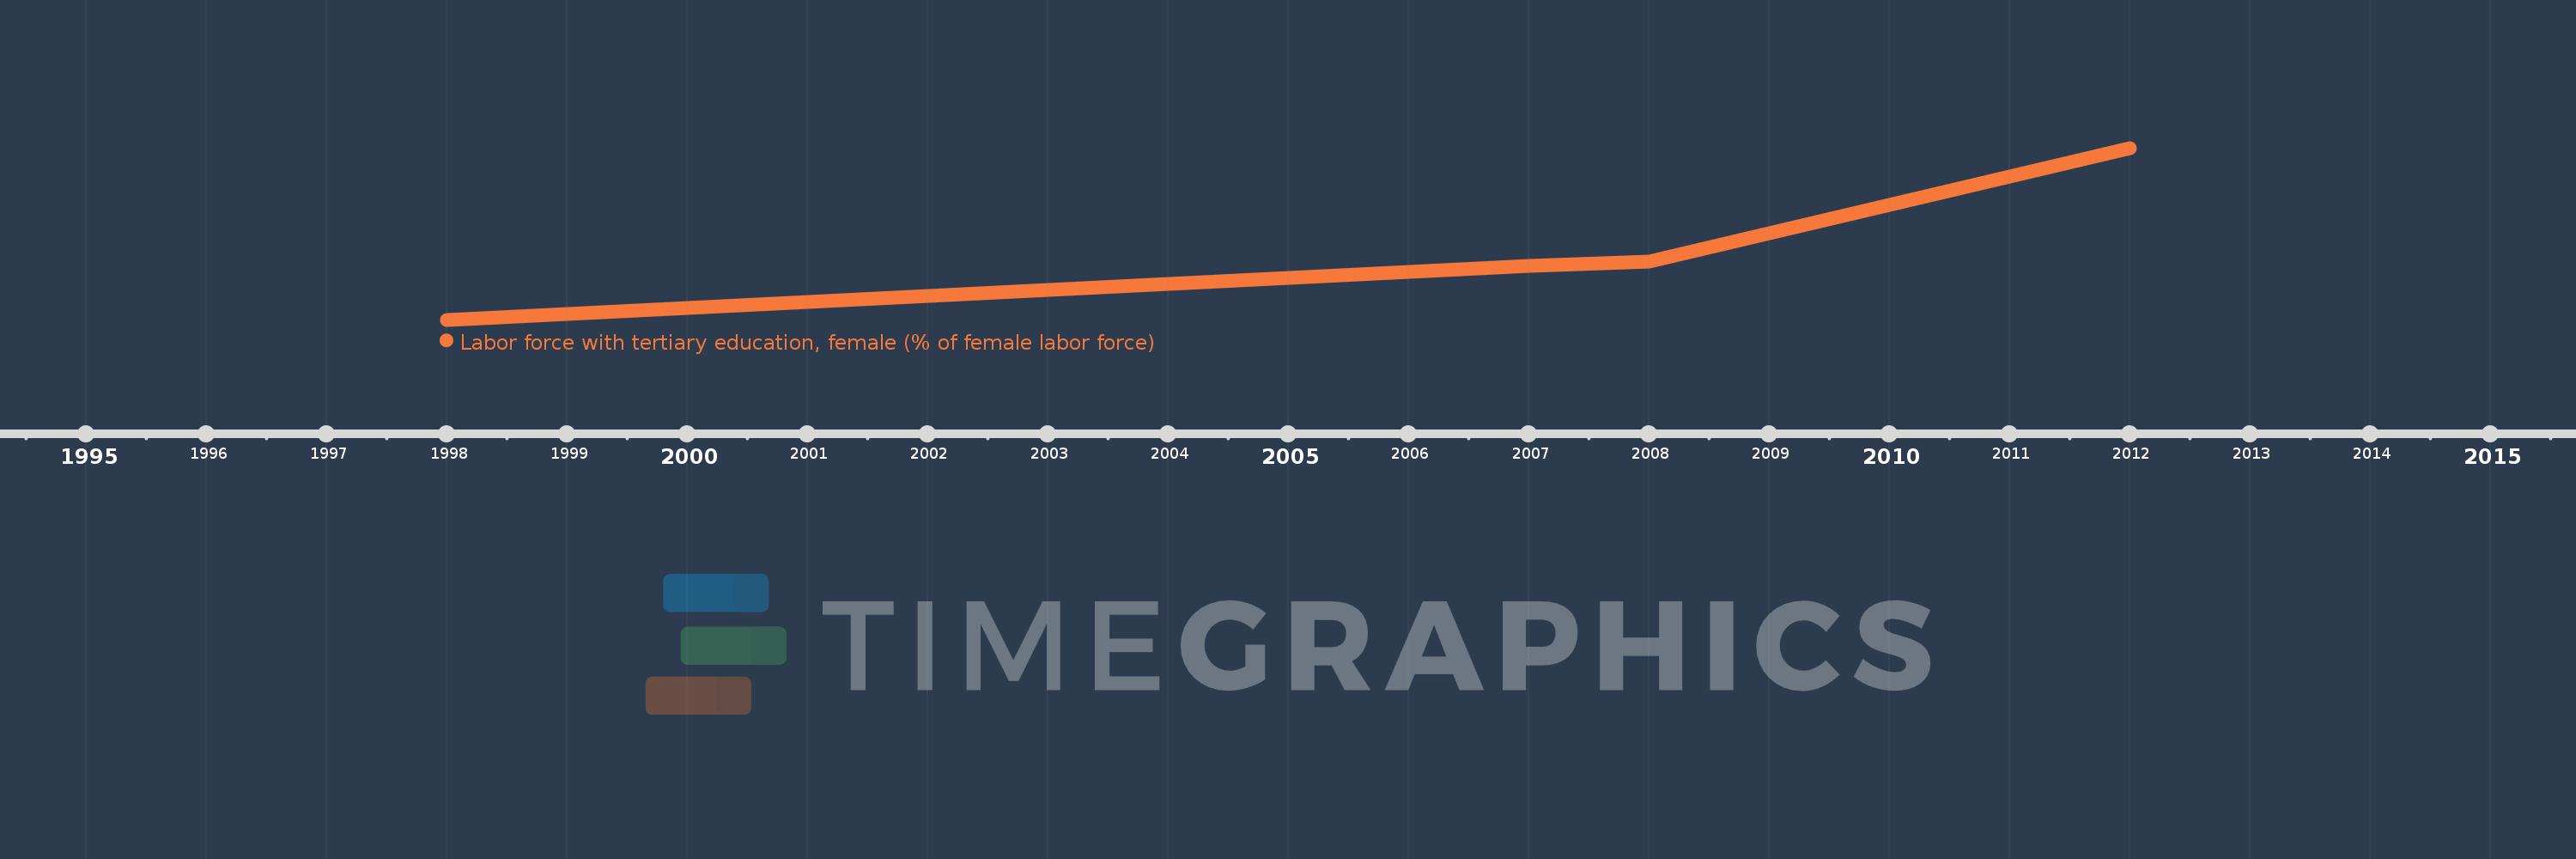
Questa scala temporale mostra un grafico dal 1998 anno al 2012 anno. Latin America & Caribbean . I dati fino ad 1997 anno non disponibili. Il numero di osservazioni attuali secondo i date: 5.
La fonte (nome):
Indicatori dello sviluppo mondiale
La fonte (organizzazione):
International Labour Organization, Key Indicators of the Labour Market database.
Categorie:
Education, Social Protection & Labor, Gender
sono stati aggiornati
23 apr 2017 anni
Indicatori delle variazioni dei valori per anni
Minima:
13.252
1 gen 1998 anni
Massimo:
24.848
1 gen 2012 anni
Alla data di osservazione
Valore
Variazione assoluta
La variazione rispetto al valore precedente
1 gen 1998 anni
13.252
+13.252
0.0%
1 gen 1999 anni
13.646
+0.394
2.97%
1 gen 2007 anni
16.87
+3.225
23.63%
1 gen 2008 anni
17.169
+0.299
1.77%
1 gen 2012 anni
24.848
+7.678
44.72%
Classificazione dei paesi secondo i statistiche attuali per anni