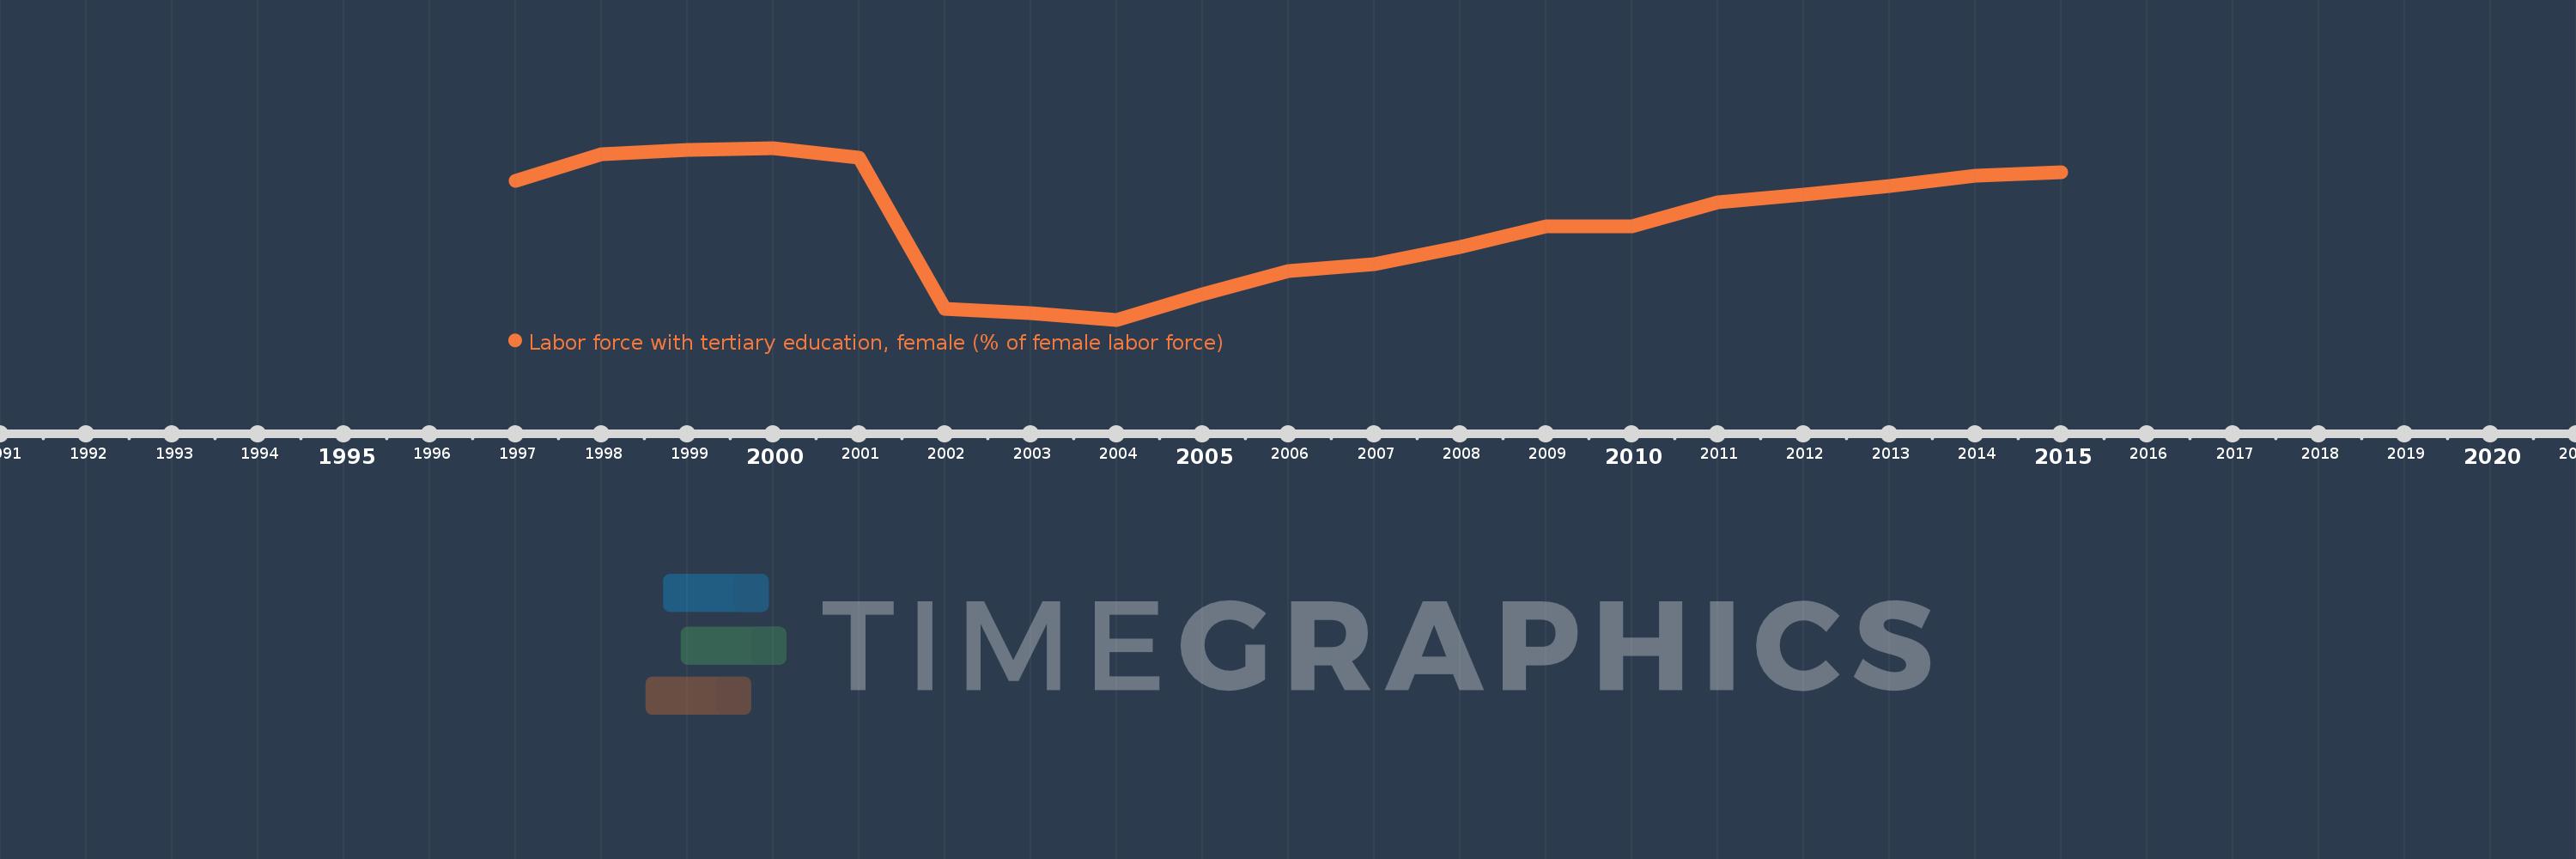
Questa scala temporale mostra un grafico dal 1997 anno al 2015 anno. Lithuania. I dati fino ad 1996 anno non disponibili. Il numero di osservazioni attuali secondo i date: 19.
La fonte (nome):
Indicatori dello sviluppo mondiale
La fonte (organizzazione):
International Labour Organization, Key Indicators of the Labour Market database.
Categorie:
Education, Social Protection & Labor, Gender
sono stati aggiornati
23 apr 2017 anni
Indicatori delle variazioni dei valori per anni
In media:
40.847
Minima:
28.5
1 gen 2004 anni
Massimo:
49.9
1 gen 2000 anni
Alla data di osservazione
Valore
Variazione assoluta
La variazione rispetto al valore precedente
1 gen 1997 anni
45.8
+45.8
0.0%
1 gen 1998 anni
49.1
+3.3
7.21%
1 gen 1999 anni
49.7
+0.6
1.22%
1 gen 2000 anni
49.9
+0.2
0.4%
1 gen 2001 anni
48.7
-1.2
-2.4%
1 gen 2002 anni
29.9
-18.8
-38.6%
1 gen 2003 anni
29.3
-0.6
-2.01%
1 gen 2004 anni
28.5
-0.8
-2.73%
1 gen 2005 anni
31.7
+3.2
11.23%
1 gen 2006 anni
34.6
+2.9
9.15%
1 gen 2007 anni
35.4
+0.8
2.31%
1 gen 2008 anni
37.6
+2.2
6.21%
1 gen 2009 anni
40.1
+2.5
6.65%
1 gen 2010 anni
40.1
0.0
0.0%
1 gen 2011 anni
43.1
+3.0
7.48%
1 gen 2012 anni
44.1
+1.0
2.32%
1 gen 2013 anni
45.2
+1.1
2.49%
1 gen 2014 anni
46.4
+1.2
2.65%
1 gen 2015 anni
46.9
+0.5
1.08%
Classificazione dei paesi secondo i statistiche attuali per anni